Example: Plotting a Function and a Matrix in 3D
Create a 3D plot from a function and from a matrix of the function's values, and then compare the results.
Plotting a Function of Two Independent Variables
Plot a function of two independent variables where the result of the function represents the Z coordinate.
1. Define a function of two independent variables.
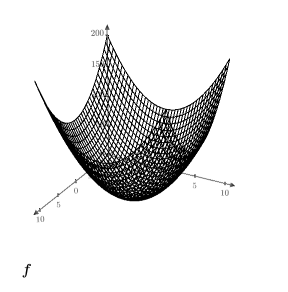
2. Press Ctrl+3 to insert a 3D plot and type f in the axis expression placeholder.
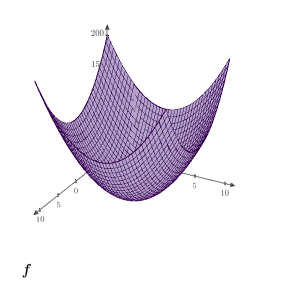
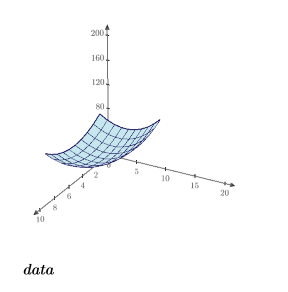
A function of two independent variables is plotted as a surface.
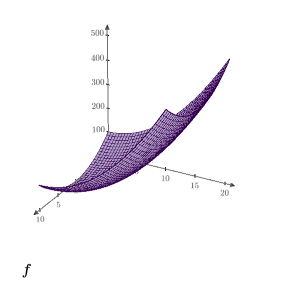
3. Change the y-axis tick marks to show the range (5, 20), and change the Surface Fill and the Trace Color.
4. Delete each tick mark value that you edited to restore the default tick mark values.
Plotting a Matrix Created from a Function
1. Use the
matrix built-in function to create a data set based on the above function.
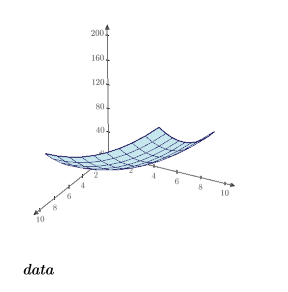
2. Plot the matrix and change the Surface Fill and the Trace Color.
This plot displays the values of the function from 0 through 9 for the x-axis and for the y-axis.
3. Change the tick marks of the y-axis to show the range (5, 20).
The plot displays a range wider than the matrix limits. The plot does not display values that are outside the matrix limits.


