Example: Monte Carlo Simulation
Use the
montecarlo function to generate random samples simulating a function.
1. Define a function to simulate.
2. Define the distribution of each parameter.
The two entries in vector
dist refer to functions
Normal and
Uniform.
3. Define the mean and standard deviation of each distribution. Record the results in matrix Rvals.
4. Set an upper limit for parameter Y.
5. Define the number of samples to generate.
6. Call montecarlo to generate the samples.
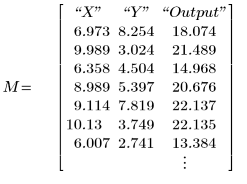
The output returned by the montecarlo function is a three-column matrix:
The first two columns are the samples generated for each parameters. The last column is the output of function f at these parameters.
7. Record the generated values into separate vectors.
You can check that the last vector R1 is indeed the outcome of function f:
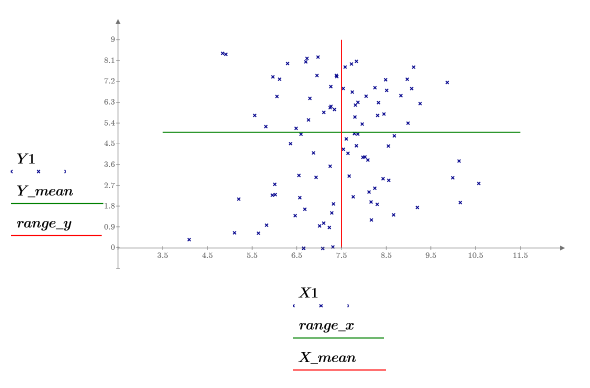
8. Plot the parameters one against the other and plot their mean.
The samples are uniformly distributed over the y-axis and normally distribution over the x-axis. Samples who had a y value above 8.5 were dismissed.
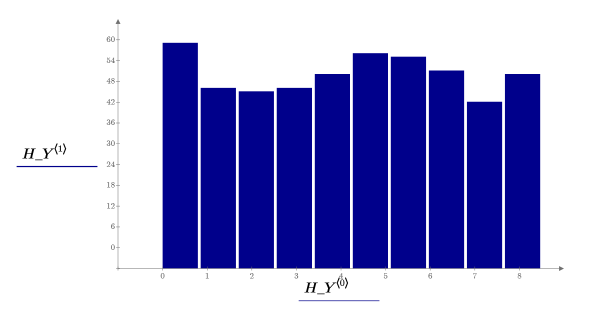
9. Call
histogram to separate the
y values into 10 bins. Plot a histogram of the
y values.
The y values are uniformly distributed. Samples are generated 6 sigmas on each side of the mean:
If the generated samples are greater than the upper limit, they are dismissed:
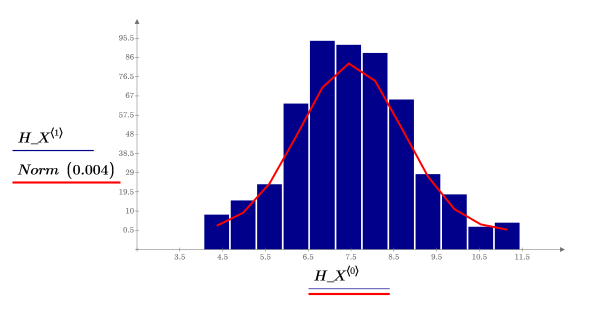
10. Call histogram to separate the x values into 10 bins. Plot a histogram of the y values and add a normal distribution.
The x values are normally distributed.
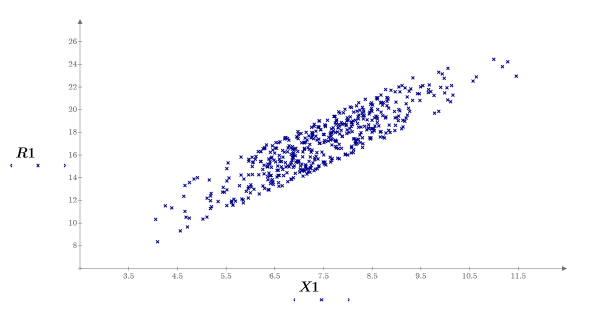
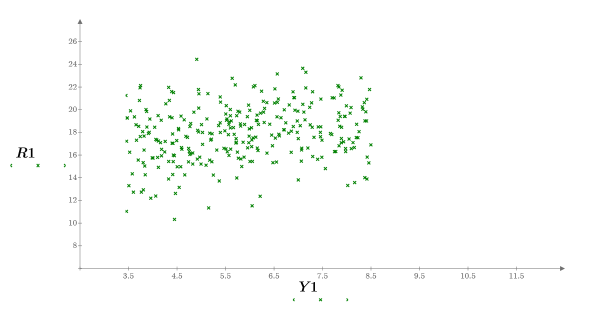
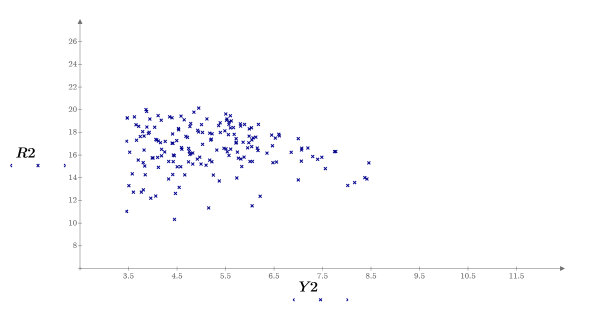
11. Plot the results against each of the parameters.
12. Call the special construct
if to define constraints and to replace the results with
NaNs when they do not fit the constraints.
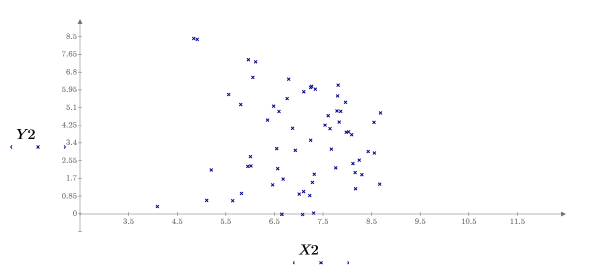
13. Plot the parameters one against each other.
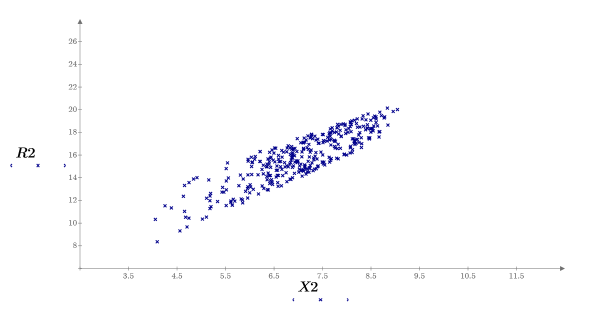
14. Plot the results against each of the parameters.


