About Density Plots
Using an XY plot, PTC Mathcad can plot up to two million data points.
When your trace has many data points, then PTC Mathcad plots the data using a technique known as density plot where a number of overlapping data points are plotted using the same pixel.
|
|
• The higher the number of overlapping data points, the darker the pixel appears in the density plot.
• If no data points fall on a particular pixel then that pixel is not filled with color.
|
Plot Styles and Number of Plotted Points
The following table summarizes the way data is plotted using XY plots.
|
The Number of Data Points
|
Available Styles Options
|
What is Being Plotted?
|
|---|---|---|
|
0 – 4999
|
All trace formatting options are fully available.
|
Each symbol represents a single data point.
|
|
5000 – 49999
|
Trace Color and Trace Thickness: Full availability.
Symbol and Line Style: Limited availability.
|
Each pixel represents one or more overlapping data points.
|
|
50000 – 2000000
|
You can only select the Trace Color.
|
Each pixel represents one or more overlapping data points.
|
Comparing Plot Appearance by the Number of Plotted Points
Consider the following function definition.


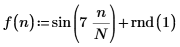
The function is plotted three times, as shown below, with various number of plotted points.
|
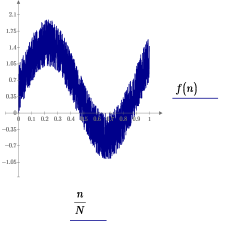
Number of Data Points: 1 ≤ N ≤ 4999
|
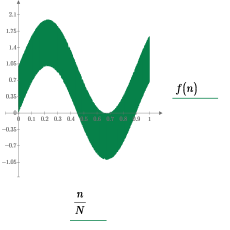
Number of Data Points: 5000 ≤ N ≤ 49999
|
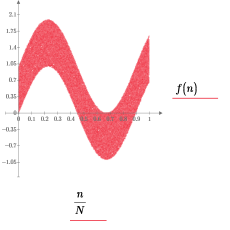
Number of Data Points: 50000 ≤ N
|
|---|---|---|
 |
 |
 |
|
• One pixel represents one data point.
• Available trace formatting options:
◦ Symbol
◦ Line Style
◦ Trace Color
◦ Trace Thickness
|
• One pixel represents one or more data points.
• Available trace formatting options:
◦ Symbol
(none) or solid circle only.
◦ Line Style
(none) or solid line only.
◦ Trace Color
◦ Trace Thickness
|
• One pixel represents one or more data points.
• Available trace formatting options:
◦ Trace Color
|