Example: Quality of Fit
Use the polyfit and polyfitstat functions to carry out a linear regression and an analysis of variance to test the quality of the fit.
1. Define a table of experimental data for a polymer process. The reaction temperature t and the catalyst feed rate fr influence the viscosity vy of the polymer.

ality of fit
2. Call the polyfit function to model the data as a linear regression.


3. Calculate the viscosity predicted for each temperature and feed rate settings.


4. Calculate the residuals (the difference between the calculated model values and the measured ones).

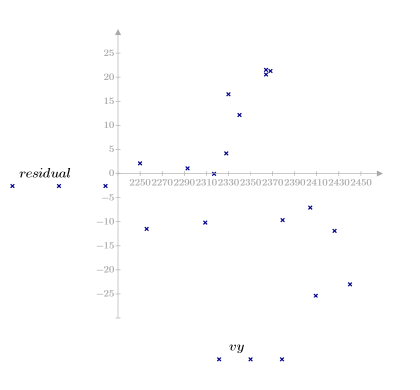
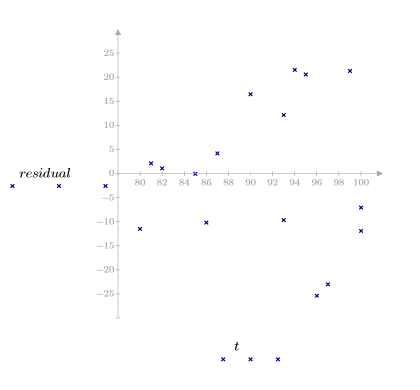
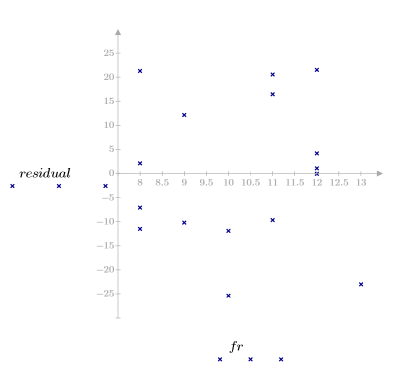
5. Plot the residuals against the observed viscosity, the temperature, and the feed rate.


The residual plots indicate that the variances of the observed viscosity and of the temperature increase as the magnitude of the viscosity and the temperature, respectively, increase.
6. Call polyfitstat to calculate various statistics for the linear model. Display the ANOVA matrix returned by polyfitstat at row 8.


In the ANOVA matrix, the sources of variance are divided between the regression and the residual components. The regression component is further divided up between the each regression coefficients. However, you cannot distinguish between the lack of fit and the pure error for the residual as the experiment results vy do not have replicates.
Calculating and Using the ANOVA table for regression
1. Calculate the sum of the squares due to error (SSE).

SSE is equal to χ2 , a general metric for the goodness of fit. This is the quantity minimized when calculating a least-squares solution. The error is a measure of how well the model fits the data. It shows how much deviation is unexplained by the regression.
2. Define the degrees of freedom for error df_error with respect to the total degrees of freedom df_total and the degrees of freedom for the parameters df_param. Degrees of freedom are the length of the data less the number of fit parameters.


3. Define the sum of squares due to the regression (SSR) with respect to the total sum of squares (SST).


4. Define the mean square error (MSE) and regression mean square (MSR). Divide the error by the appropriate degrees of freedom.


5. Form an analysis of variance table to characterize the fit.
Sum-of-Squares | DF | Mean-Square | F Factor | |
|---|---|---|---|---|
Regression |  |  |  |  |
Error |  |  |  | |
Total |  |  |
You can compare the table above with the polyfitstat ANOVA matrix.

6. Estimate of how well the model fits the data:


This indicates that 92.7% of the variability in viscosity is explained by the linear regression model.
7. Define the level of significance for an hypothesis test to test if the model fits the data.

8. Calculate the critical F-value.

9. Test the hypothesis that the model fits the data.

Accept the hypothesis. You can predict the viscosity of the polymer with this linear regression model.
Reference
Montgomery, D.C., Design and Analysis of Experiments, 5th ed., John Wiley & Sons, New York, 2001, pp. 398