Insert a Chart component, define the X and Y expressions, plot the trace, and then double-click the plot area to open the PTC Mathcad Chart application.
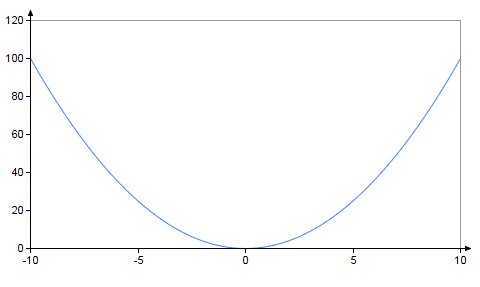
The chart below appears in the graphics area:
To Show or Hide Gridlines Using Ribbon Templates
1. In the Ribbon, click the Axes tab.
The Axes Styles group displays the default template, Axes Styles: Linear, of the Axes Styles which contains no gridlines:
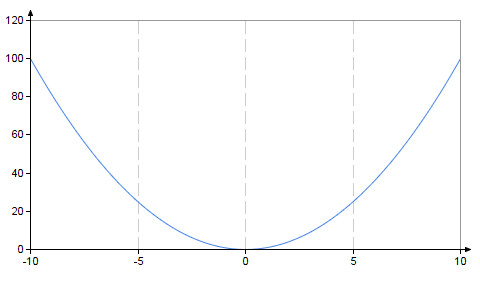
2. Click the Axes Styles: X Gridline to show the X gridlines.
3. Click each of the other templates to apply one of these other gridlines:
◦ Axes Styles: Y Gridlines to show the Y gridlines
◦ Axes Styles: X and Y Gridlines to show the X and Y gridlines
◦ Axes Styles: No Axes to hide the axes
◦ Axes Styles: Linear/Log to show the Linear/Log gridlines
◦ Axes Styles: Log/Linear to show the Log/Linear gridlines
◦ Axes Styles: Log/Log to show the Log/Log gridlines
4. To hide the gridlines, click the default template.
To Format the Gridlines on the Sidebar
You can format the x-axis gridlines color, style, and thickness.
1. Click the x icon , and then click the Gridlines tab.
2. Select the X-axis Gridlines checkbox, and then specify the Color, Style, and Thickness.
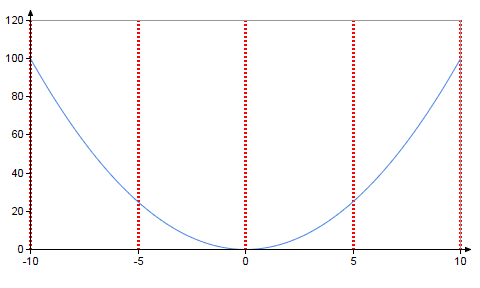
For example, the chart below shows x-axis gridlines color of red, style of a dotted line, and thickness of line width 3:
To restore the formatting settings of the X-axis Gridlines, click the clear formatting icon .
Use the same procedure to format the y-axis gridlines.

 , and then click the Gridlines tab.