Example: Probability Distributions
Use probability distribution functions in place of probability distribution tables.
Probability Density
1. Use the dchisq function to calculate the probability density of a chi-squared variable, with 11 degrees of freedom, at 5.5:
2. Use the dt function to calculate the probability density of variable t with 4 degrees of freedom, at -1.56:
Cumulative Probability
1. Use the pnorm function to calculate the probability that a standard normal variable exceeds 1.0:
2. Use the pchisq function to calculate the probability that a chi-square variable, with 7 degrees of freedom, is less than 5.6:
3. Use the pbinom function to calculate the probability that a binomial variable with size 15 and parameter 0.6 is less than or equal to 10.
4. Use the qbinom function to calculate the probability that a binomial variable with size 15 and parameter 0.6 is less than or equal to 10.
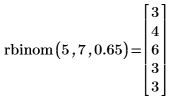
5. Use the rbinom function to create a vector of m=5 random numbers having the binomial distribution with size n=7 and probability of success q=0.65.
| Recalculating the worksheet causes function rbinom to return a new set of random numbers. |
6. Use the dbeta function to calculate the probability density for value x=0.8 for real shape parameters 3 and 2:
7. Use the pbeta function to calculate the probability that a beta variable with a=3 and b=2 exceeds 0.8:
8. Use the qbeta function to calculate the inverse cumulative probability distribution for probability p=0.8:
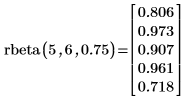
9. Use the rbeta function to create a vector of m=5 random numbers having the binomial distribution with size n=6 and probability of success q=0.75.
Inverse Cumulative Probability
1. Use the qnorm function to calculate the inverse cumulative probability distribution for probability p:
2. Use the qt function to calculate the inverse cumulative probability distribution for probability p:
F-Distribution
1. Use the dF function to calculate the 65th percentile for the F distribution with 4 and 6 degrees of freedom:
2. Use the pF function to calculate the cumulative probability distribution for probability 0.75 with 5 and 7 degrees of freedom:
3. Use the qF function to calculate the 95th percentile for the F distribution, with 9 and 8 degrees of freedom:
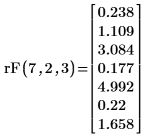
4. Use the rF function to create a vector of 7 random numbers having the F-distribution with 2 and 3 degrees of freedom:
| Recalculating the worksheet causes function rF to return a new set of random numbers. |


