Workflows Trends Page
The Workflows Trends page displays information about authored and used workflows in graphical format.
1. To go to the Workflows Trends page, do one of the following:
◦ Click the Total Authored Workflows gadget on the dashboard.
OR
◦ In the Go to page list, select Workflows Trends.
2. In the ThingWorx Server list, select the ThingWorx server for which you want to display data.
3. Provide the time frame in the FROM and TO date selector fields.
4. In the All Data list, select one of the following:
◦ All Data—Displays data from PTC apps and non-PTC apps.
◦ PTC Apps—Displays data from PTC apps only, such as Navigate, DPT, and SCO.
◦ Unclassified—Displays data from non-PTC apps only.
|
|
If your ThingWorx server does not have data from either PTC Apps or non-PTC apps, this option is not available.
|
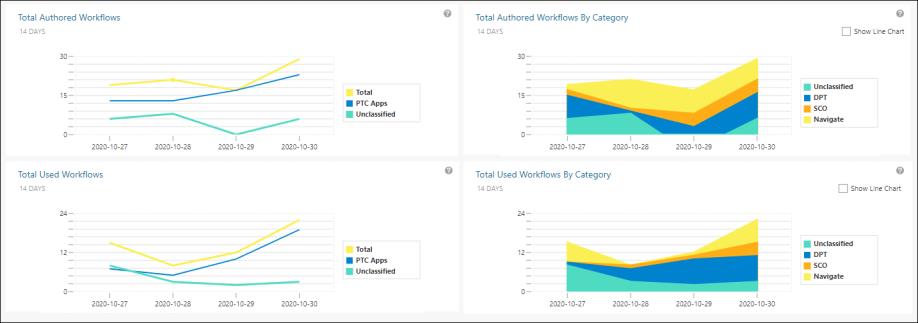
The following graphs are displayed:
◦ Total Authored Workflows—Displays the total number of authored workflows for the selected time frame in the form of a line chart.
Hover the cursor over different data points in the line chart to see the exact number of authored workflows for a particular date.
◦ Total Authored Workflows by Category—Displays the total number of authored workflows for the selected time frame by category (PTC Apps and Unclassified). Select the Show Line Chart check box to see the information in the form of a line chart.
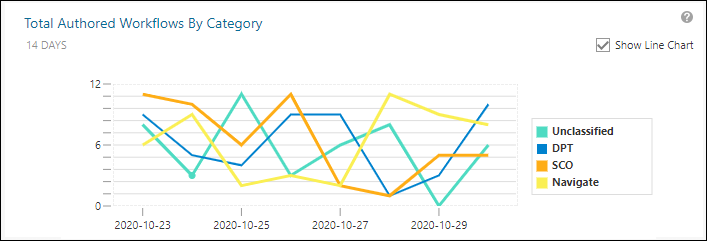
Hover the cursor over different data points in the line chart to see the exact number of authored workflows for a particular date in the selected time frame.
◦ Total Used Workflows—Displays the total number of used workflows for the selected time frame in the form of a line chart.
Hover the cursor over different data points in the line chart to see the exact number of used workflows for a particular date.
◦ Total Used Workflows by Category—Displays the total number of used workflows for the selected time frame by category (PTC Apps and Unclassified). Select the Show Line Chart check box to see the information in the form of a line chart.
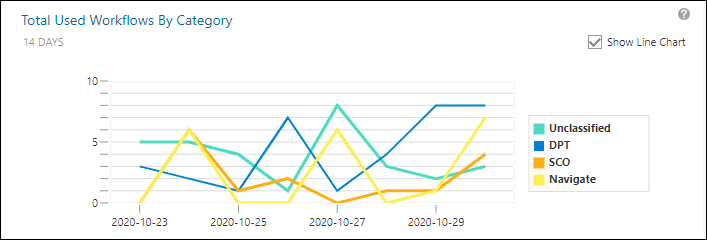
Hover the cursor over different data points in the line chart to see the exact number of used workflows for a particular date in the selected time frame.
To go back to the dashboard, click Dashboard, or in the Go to page list, select Workflows Usage (Dashboard).