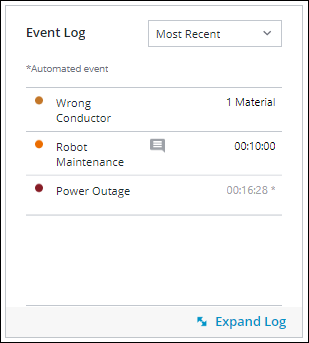
Collapsed Event Log View
The collapsed view of the event log displays in the Event Log pane on the Production Dashboard. This view shows the loss events for the current production block, with the recent most event at the top. For each event, a visual indicator for the selected loss category, the selected loss reason, and the impact (duration or quantity) is displayed. If a reason category is selected or no loss reason is selected for the event, the loss reason is blank. If you have selected a parent or child loss reason, the loss reason is displayed. If any comments were entered for the loss event, a comment ( ) is displayed. If the reason selected for the event is not at the lowest level of the reason tree, an alert icon (
 ) is displayed.

There are multiple filters available for the Event Log pane:
• Most Recent—Displays the most recent events at the top of the list. This is the default view.
• Alerts First—Displays events with alerts at the top of the list.
• Alerts Only—Displays only events with alerts.
To view events for the work center outside of the current production block, click Expand Log.