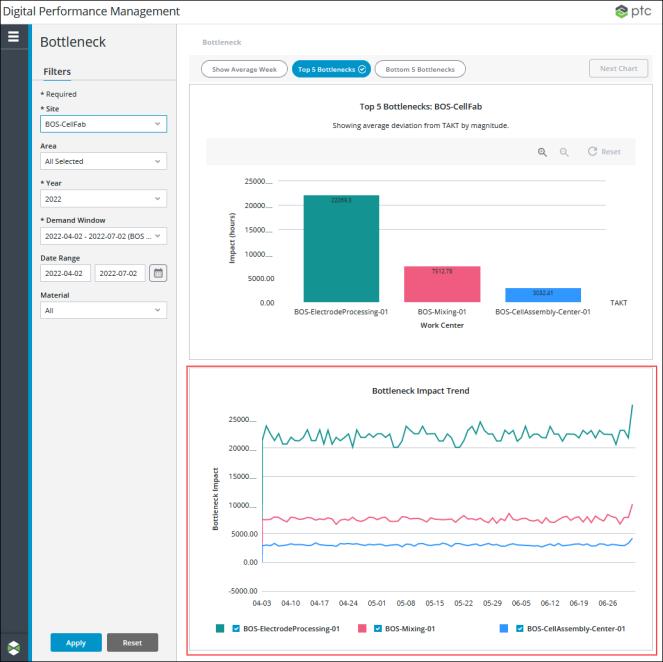
Bottleneck Trend Mashup
|
|
This mashup is designed to be easily replaced with a customized mashup so long as the customized mashup has the same inputs and outputs. For more information, see Replacing Modular Mashups.
|
The bottleneck trend mashup (PTC.BottleneckAnalysis.BottleneckTrend_MU) displays the trend chart in the bottom pane when no work center is selected in the main bottleneck chart.

Widgets
The PTC.BottleneckAnalysis.BottleneckTrend_MU mashup uses a single Line Chart widget.
Inputs
The input parameters for the PTC.BottleneckAnalysis.BottleneckTrend_MU mashup are:
• managerName—The name of the manager Thing from which the services on this mashup are run.
• workCenters—An infotable with information for the work centers that are displayed in the chart.
• startDateTime—The start date from the applied Date Range filter, if any.
• endDateTime—The end date from the applied Date Range filter, if any.
• materialMasterUid—The UID for material that is selected in the Material filter, if any.
• materialDemandWindowUid—UID of the demand window from the applied Demand Window filter.
Outputs
The PTC.BottleneckAnalysis.BottleneckTrend_MU mashup has no output parameters.
Services
The mashup uses the following dynamic service from the PTC.BottleneckAnalysis.Management_TS Thing Shape:
• GetBottleneckTrendDisplayData—Retrieves the trend data for the work centers that are displayed in the main bottleneck chart.
Dynamic services allow you to select the entity to execute a service at runtime. In this case, the service can be executed from any entity that implements the PTC.BottleneckAnalysis.Management_TS Thing Shape. For more information, see Dynamic Services in the Mashup Builder section of the ThingWorx Help Center.