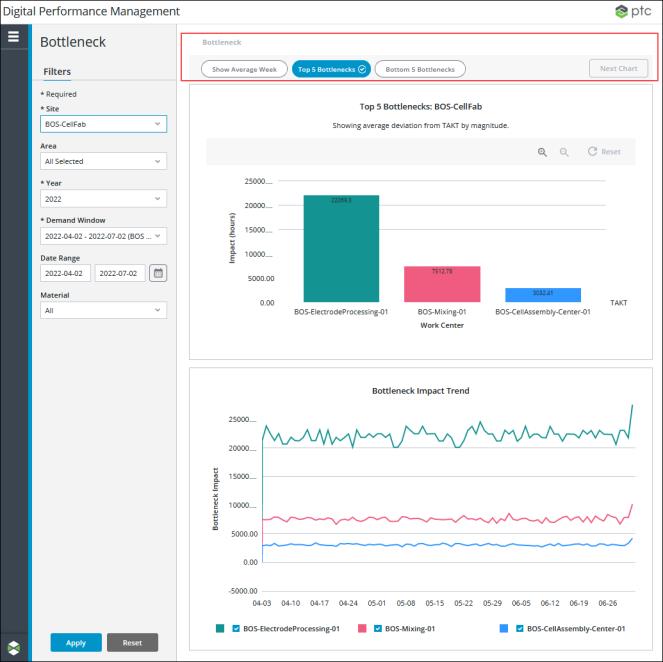
Analysis Header Mashup
The analysis mashup (PTC.BottleneckAnalysis.AnalysisHeader_MU) displays the navigation breadcrumb and the toolbar containing multiple buttons: Show Average Week, Top 5 Bottlenecks, Bottom 5 Bottlenecks, and Next Chart.

Widgets
The PTC.BottleneckAnalysis.Bottleneck_MU mashup uses the following widgets:
• A Breadcrumb widget, for the navigation breadcumb.
• A Toolbar widget, for the toolbar with buttons.
Inputs
The input parameters for the PTC.BottleneckAnalysis.AnalysisHeader_MU mashup are:
• materialMasterUid—The UID for material that is selected in the Material filter, if any.
• startDateTime—The start date from the applied Date Range filter, if any.
• endDateTime—The end date from the applied Date Range filter, if any.
• navigationHistory—An infotable containing the navigation history of the selected work center and the bottom panes that are shown for that work center.
• managerName—The name of the manager Thing from which the services on this mashup are run.
• selectedBar—An infotable containing the information for the bar that is selected in the bottleneck chart.
Outputs
The output parameters from the PTC.BottleneckAnalysis.AnalysisHeader_MU mashup are:
• bottomChild1LinkMashup—Name of the mashup shown on the bottom left panel. Determined by whether a filter has been applied and data is shown in the bottleneck, or if a bar in the bottleneck chart is selected.
• bottomChild2LinkMashup—Name of the mashup shown on the bottom right panel. Determined by whether a filter has been applied and data is shown in the bottleneck, or if a bar in the bottleneck chart is selected.
• bottomLinkMashup—Name of the mashup that holds the contained mashups displayed in the bottom panel.
• showTopBottlenecks—Boolean determining whether the top five bottlenecks (true) or bottom five bottlenecks (false) are shown.
• showAverageWeek—A Boolean indicating the state of the Show Average Week button.
• linkMashup—The name of the chart mashup to be shown in the contained mashup of the bottleneck chart.
• navigationHistory—An infotable containing the navigation history of the selected work center and the bottom panes that are shown for that work center.
Services
The mashup uses the following service from the PTC.BottleneckAnalysis.Manager Thing:
• GetToolbarConfiguration—Retrieves the buttons to be shown in the toolbar.
The mashup uses the following dynamic services from the PTC.BottleneckAnalysis.Management_TS Thing Shape:
• GetCurrentNavigationHistoryRow—Retrieves the data for the chart mashup and bottom panels to be displayed from the navigationHistory infotable.
• GetRootMashupConfiguration—Retrieves the name of the mashup to be shown when the Next Chart button is clicked.
• InitializeNavigationHistory—Initializes the navigationHistory infotable with the default data.
• ResetNavigationHistory—Resets the navigationHistory infotable to the default data.
• UpdateChartNavigationHistory—Updates the navigationHistory infotable based on the bar that is selected in the bottleneck chart.
Dynamic services allow you to select the entity to execute a service at runtime. In this case, the service can be executed from any entity that implements the PTC.BottleneckAnalysis.Management_TS Thing Shape. For more information, see Dynamic Services in the Mashup Builder section of the ThingWorx Help Center.