About Curvature Plots
A curvature plot is a graphical representation that shows the curvature at a set of points along a curve. Curvature plots are used to analyze the smoothness of a curve.
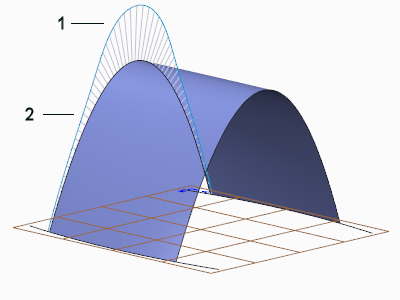
The curvature plot shows the curve smoothness and mathematical curvature by displaying lines that are perpendicular to the curve (normals). The longer these lines are, the greater the amount of curvature.
1. Area of relatively high curvature
2. Area of relatively low curvature
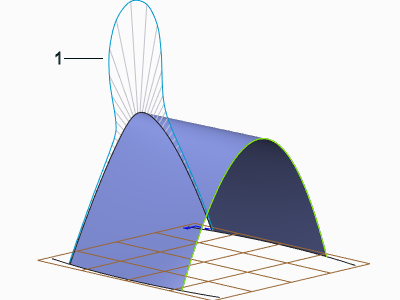
Ideally, a curvature plot should be smooth. Dips and bumps in the curvature plot are signs that the curve has a rapid change in shape. However, a corner or crease in the curvature plot does not indicate a crease in the curve, only a sharp change in the curvature. The curve is still tangent continuous internally.
1. Abrupt change in curvature
Curvature plots are interactive. They update as the curve is modified. You can change the number of plotted segments, the relative size of the plot, and the type of curvature.