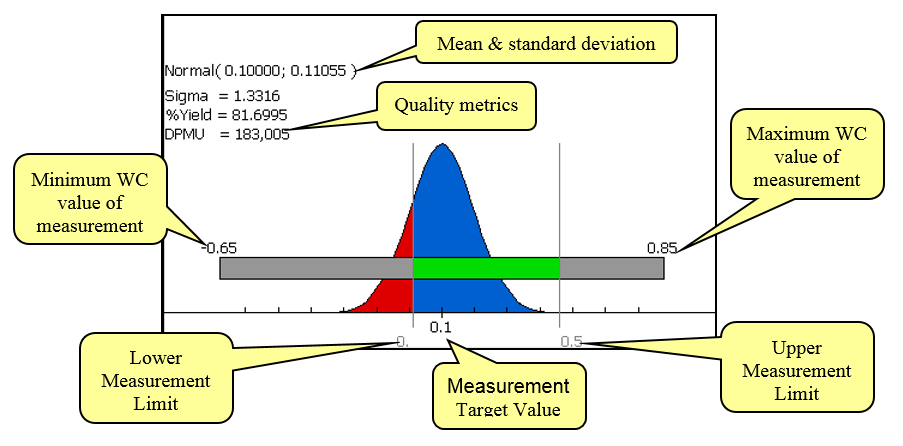
The Variation Plot
The variation plot shows the worst-case range and statistical distribution for the measurement. You can use the shortcut menu for the variation plot to turn off the display of the statistical or worst-case plot.

The measurement specification limits and the target value are user-specified values. These define the design requirements for the measurement. The statistical variation is represented by a statistical distribution. Creo Tolerance Analysis powered by CETOL Technology supports three distribution types: Normal, Uniform, and Lambda. The distribution moments depend on the distribution type, which is determined based on best-fit criteria. For most real-life problems, the results will be represented by either a normal or lambda distribution.
The table below shows the formulas used to calculate quality metrics.
|
Metric Name
|
Metric Definition
|
|
Sigma
|
See description below
|
|
%Yield
|
x = Tolerance or measurement pdf(x) = Probability distribution of x |
|
DPMU
|
|
The value for Sigma is calculated by first calculating first time dpo (defects per unit opportunity), and then finding a one-sided Z-score that has the same first time dpo. A one-sided Z-score is the value of a unilateral limit for a normal distribution with a mean equal to zero and standard deviation equal to one.


