Getting Started with GDX
Generative Design Extension (GDX) is a cloud-only portal that does not require an installation. However, a Generative Topology Optimization license is required to set up study definitions that can be sent to the cloud and computed by GDX. If you want access to GDX, contact your administrator. When you access GDX for the first time, you must authenticate your account with the application.
|
|
When you access GDX for the first time, you are prompted to select your enterprise account. This selection is cached in Creo Parametric.
|
Compatibility and Browser Support
GDX is supported on the following browsers:
• Mac/Windows Chrome 86.0.4240.111 and later versions
• Mozilla Firefox 82.0 and later versions
• Microsoft Edge 86.0.622.48 and later versions
User Interface Overview
The user interface of GDX contains two pages: the Study page and the Dashboard.
Study Page
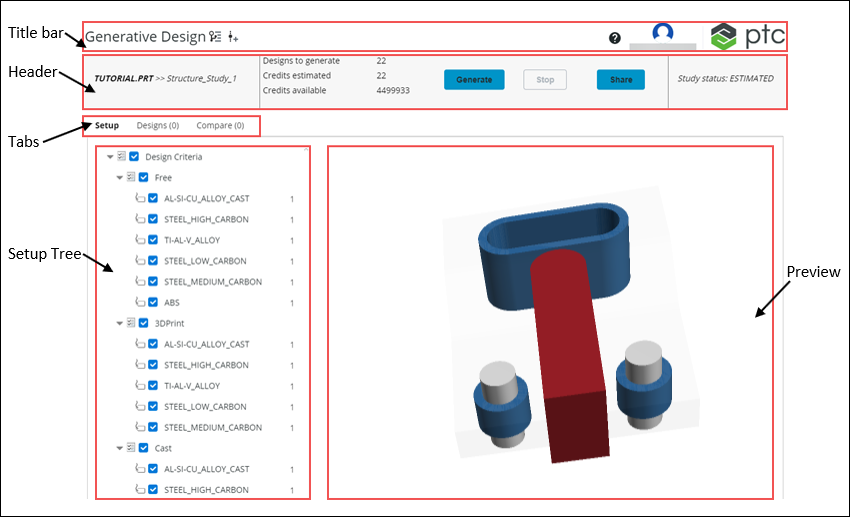
The following image shows the different panels of the Study page:
The following table describes the panels of the Study page:
|
Panel
|
Description
|
||
|---|---|---|---|
|
Title bar
|
Contains the
 and and  commands to work with Versions and history. You can click commands to work with Versions and history. You can click  to access the reports and the Help. You can click your name to sign out of GDX. to access the reports and the Help. You can click your name to sign out of GDX.
|
||
|
Header
|
Displays the part name, study name, study status, and the information related to the designs and credits. It also contains the commands to generate designs, stop the design generation, and share the study with others.
|
||
|
Tabs
|
The Setup tab contains the Setup Tree and the preview of the uploaded study. The Design tab contains the generated designs and related graphs. The Compare tab contains the designs you have selected for comparison.
|
||
|
Setup Tree
|
Displays the design criteria and materials related to the study uploaded from Creo Parametric.
|
||
|
Preview
|
Displays a preview of the study. You can use the mouse scroll button to spin, pan, and zoom the preview. Double-click to adjust the zoom level to fully display the preview. You can also set a background color for the preview.
|
Dashboard
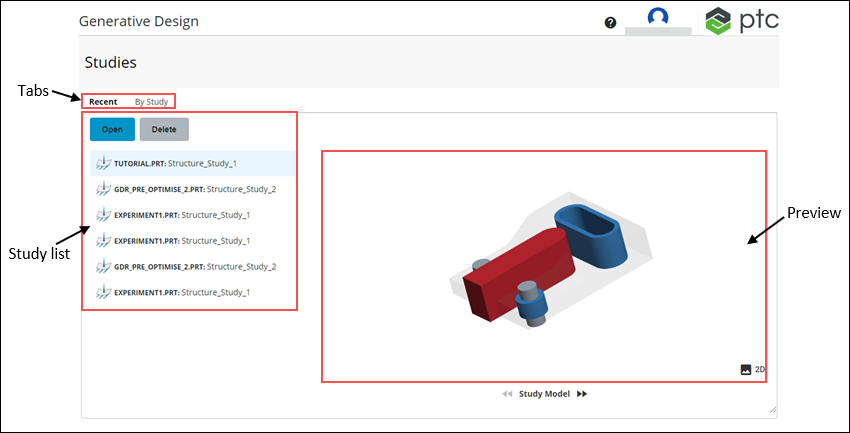
The following image shows the different panels of the Dashboard:
The following table describes the panels of the Dashboard:
|
Panel
|
Description
|
||
|---|---|---|---|
|
Tabs
|
The Recent tab lists the recent studies. The By Study tab lists all the studies and also contains filters to filter the studies by their names, models, or any other field.
|
||
|
Study list
|
Lists the studies you have created or those shared with you. It also contains the commands to open or delete the selected study.
|
||
|
Preview
|
Displays a preview of the selected study. In the lower-right corner, you can click
 to switch to the 3D view or to switch to the 3D view or  to switch to the 2D view. to switch to the 2D view.
|