Creo Flow Analysis Interface

1. CFA Ribbon
2. Group
3. Functions Panel
4. Flow Analysis Tree
5. View Panel
6. Property Panel
7. Plot Panel
Flow Analysis Tab
When you open an assembly file, the Flow Analysis tab appears. The Flow Analysis tab contains the options for Flow Analysis to perform the simulation. The options are divided into the groups listed below:
Group | Icon Description |
|---|---|
Project | Create, save, open, close, import, and export projects |
Updates | Update projects or fluid domain, to modify the fluid domain when there are changes made to the CAD model |
Simulation Domains | Create a fluid domain for a CAD geometry, split them and add them as simulation domains to perform calculations |
Materials | Open the Material Selection dialog box |
Operations | Generate Mesh, add Physics Models, Add Boundary Conditions, View, open Expression Editor, and set-up Behavioral Modeling |
Show | Control the display of CAD bodies, Flow Analysis (Creo Flow Analysis) bodies, XYPlot Panel (Residual Panel) and Working condition overview |
Working Condition Overview | The Working Condition Overview displays the flow and heat boundary condition that are assigned to boundaries along with the flow direction. It also displays any momentum source, mass source or heat source assigned to volumes. |
Post-processing | Create Sections, XY-plots, Isosurfaces, Streamlines, Monitor points, enable Real-time probe, and view Grid and Geometry related information |
Run | Run, Pause, and Stop a simulation, control the start point of the simulation, select steady or transient simulations, and run multiple projects in batch mode |
Close | Closes the Flow Analysis tab |
Flow Analysis Tree
The Flow Analysis Tree is organized according to the Flow Analysis workflow. The Flow Analysis Tree provides access to the geometric entities such as CAD surfaces, boundaries, and domains in a project that you can manage for the analysis. The available entities are listed below:
• Project — Access multiple simulation projects. Following options are available upon right-click on any project in the Flow Analysis Tree.
◦ Activate – Make the selected project active.
◦ Duplicate – Create a copy of the selected project.
◦ Delete – Delete the selected project.
• Physics—Lists the physical modules used in the simulation. Upon right-clicking, it opens the Physical Model Selection dialog box which can be used to add physical modules to the simulation.
• Domains—Lists the fluid domains in the model. Upon right-clicking an entity under Domains, the following options appear:
◦ Redefine—Opens the Fluid Domain Creation tab where you redefine the domain.
◦ Add Boundary Condition—Adds a boundary. Opens the Surface Sets dialog box where, under Included Surfaces, you select the surfaces for a boundary.
◦ Remove—Deletes the domain.
• Boundary Conditions—Boundaries of the fluid domain under General Boundaries
• Results—Entities created after meshing, and for postprocessing
◦ Derived Surfaces—Lists the created sections and isosurfaces
◦ XY Plots—Displays the quantitative results of the simulation
◦ Monitoring Points—Records variables or properties data at a specific location
◦ Streamlines—Tracks the path of flow
◦ Particles—Tracks particles of flow or particles moving with the flow
Functions Panel
The Functions Panel is part of the Flow Analysis Tree as shown in figure
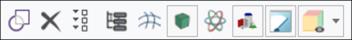
From the Functions panel you can control the entities and your view of the entities in the Flow Analysis Tree.
Icon | Description |
|---|---|
 | Connects two boundaries to create the mismatched grid interface (MGI) |
 | Deletes the selected geometric entity |
 | Expand All/ Collapse All This allows users to display/hide the entities in the Flow Analysis Tree |
 | Advanced Tree enables/disables the CAD Surfaces list under Flow Analysis Tree |
 | Display Highlighted Geometric Entities Only shows only selected or all simulation geometries |
 | Change boundary appearance to model/view allows user to point and select either CAD entities or Simulation entities. Selecting Simulation entities like boundaries, interfaces or volumes help to assign boundary condition and post-process. For example, user can point and select the outlet boundary to change the boundary condition or to plot variables. The two modes are explained as follows: • To show CAD Entities, select Change boundary appearance to model/view. In this mode, the CAD entities are selected upon left-click on the geometry. The corresponding part is also highlighted in the Flow Analysis Tree.• To show Simulation Entities, select  Change boundary appearance to model/view in the Functions Panel. In this mode, the simulation entities are selected upon left-click on the geometry. The corresponding boundary, interface or volume is highlighted in the Flow Analysis Tree. Change boundary appearance to model/view in the Functions Panel. In this mode, the simulation entities are selected upon left-click on the geometry. The corresponding boundary, interface or volume is highlighted in the Flow Analysis Tree. |
 | Selection Type allows user to point and select either volume or boundaries/interfaces. The two modes are explained as follows: • Selection of Simulation volumes:-Select  Selection Type to switch to Volume selection. In this mode, the simulation volumes are selected upon left-click on the geometry. The corresponding volume is highlighted in the Creo Flow Analysis Tree. Selection Type to switch to Volume selection. In this mode, the simulation volumes are selected upon left-click on the geometry. The corresponding volume is highlighted in the Creo Flow Analysis Tree.• Selection of Simulation boundaries/interfaces: Select Selection Type to switch to boundary selection. In this mode, the simulation boundaries and interfaces are selected upon left-click on the geometry. The corresponding boundaries/interfaces are highlighted in the Creo Flow Analysis Tree. |
 | Refresh Variables resets the range of displayed variable to global minimum and maximum. |
 | Switches the view of the grouping for geometric entities. You can view as a hierarchy based on volumes or as independent categories, based on type. |
 | Turn on/off view properties allows global display control of all the surfaces, grids, and outlines. |
Select Through — Left-click to select the outermost geometry at the location of mouse pointer. The selection tool switches to the next inner geometric entity upon subsequent left clicks, until it reaches innermost geometry and then cycles through. |
Properties Panel
The Properties panel contains information about geometric entities and physical modules. The parameters and conditions on the Properties panel depend on your selection in the Flow Analysis Tree. This panel contains the Model tab and the View Tab.
• Model Tab
◦ Mesh-related parameters—Appear when you click Domains in the Flow Analysis Tree.
◦ Physical module-related parameters—Conditions related to the physics being studied. Parameters vary according to the selection in the Flow Analysis Tree:
▪ Numerics, convergence, and more options appear when you select a module under Physics.
▪ Boundary conditions appear when you select a boundary under General Boundaries.
▪ Interface and MGI-related options appear when you select the entity under Boundary Conditions
▪ Volume-related conditions appear when you select a fluid domain under Domains.
• View Tab—Contains parameters to change the display in the Display window.
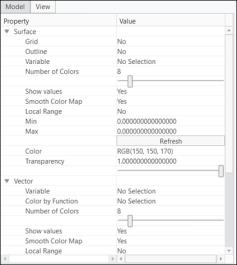
◦ Surface—Displays the primary variables (such as pressure, velocity or temperature), physical properties (such as density, viscosity), or derived variables (such as total pressure, velocity magnitude, enthalpy) when you select boundaries, derived surfaces, interfaces, CAD surfaces, and volumes. The options available under Surface are listed below:
▪ Keep drawing—Displays the surface of the boundaries, derived surfaces, interfaces, CAD surfaces, and volumes.
▪ Grid—Displays the grid (mesh) on boundaries, derived surfaces, interfaces, CAD surfaces, and volumes.
▪ Outline—Displays the outline on boundaries, derived surfaces, interfaces, CAD surfaces, and volumes.
▪ Transparency–Control the transparency of Boundaries, Derived Surfaces, Interfaces, CAD Surfaces, and/or Volumes.
▪ Number of Colors—Specifies the number of legend colors.
▪ Show values—Displays all values in the legend.
▪ Smooth Color Map—Changes display mode of the color bar.
▪ Local Range—Sets the color map range based on the local values in the entity.
▪ Min and Max—Adjusts the bounds for the color bar for contours.
◦ Vector—Displays vectors on boundaries, derived surfaces, interfaces, CAD surfaces, and volumes. The options available under Vector are listed below:
▪ Color By Function—Select a primary variable, physical property, or derived variables for display on the vectors.
▪ Color—Select a legend to associate with the display variable.
▪ Size—Controls the size of the vectors. These are also controlled by the slider bar.
▪ Uniform Head—Switch between uniform head size and head size depending on the vector magnitude.
▪ Head Size—Manually change the vector head size depending on your input.
▪ Projection—Project the vectors onto the selected surface.
View Panel
The View Panel is available upon selection of volumes, boundaries, interfaces, and derived surfaces from Creo Flow Analysis Tree or Graphics Window.

The following options are available under View Panel as shown in Table below, these are same as options available in the View Tab of the Properties Panel. Refer View Tab for more information.
Surface | Vectors |
|---|---|
 Show—Enables display of the geometric entity Show—Enables display of the geometric entity |  Show Vector Show Vector |
 Grid Grid |  Variable Variable |
 Outline Outline | |
| Variable |  Color Color |
 Color By Function Color By Function | |
 Surface Side Surface Side |  Projection Projection |
| Color |  Size Size |
On selection of boundaries or interfaces, the  drop down option is available, which allows users to change the boundary condition for Flow module.
drop down option is available, which allows users to change the boundary condition for Flow module.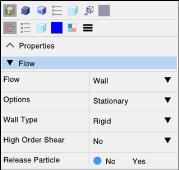
Geometry Selection Tool
The Geometry Selection Tool can be used to enter the coordinate of a point by selecting either CAD or Simulation geometric entities. It can be accessed by clicking on  where a coordinate is required as an input, for example, Rotational Center for Volume. Remesh by Rotation as shown in the figures below:
where a coordinate is required as an input, for example, Rotational Center for Volume. Remesh by Rotation as shown in the figures below: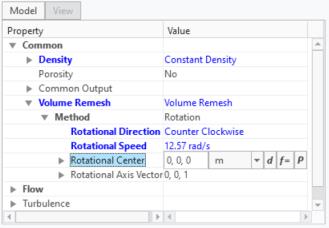
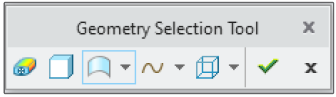
The following options are available under Geometry Selection Tool as shown in table below:
Direct Point on Simulation Surface  | Uses the coordinate of point at the location of the pointer on the highlighted simulation surface. |
Body  | Uses the location of centroid of the selected CAD body. |
CAD Surface  | Uses the selected CAD surface. The point location can be defined using two options: Direct point on a CAD surface or Centroid of a CAD surface. |
Curve  | Uses the selected curve. The point location can be defined using four options: direct point on a curve, start, middle or end point of a curve. |
Edge  | Uses the selected edge. The point location can be defined using five options: center of a circle, direct point on an edge, start, middle or end point of an edge. |
Dialog Boxes for Creo Flow Analysis
• Domain Model Selection—Select the fluid and solid components or domains for the simulation from the Model Tree.
To open the Domain Model Selection dialog box, click  Select Simulation Domains.
Select Simulation Domains.To add the fluid component, follow the steps listed below:
1. Click Add fluid domain.
2. In the Model Tree, select the fluid part. This is the .PRT file.
3. Middle-click to confirm. The fluid component is added under Fluid Components.
4. Click OK.
To add the solid component, click Add solid component and follow steps 2,3,4.
• Surface Sets—Select surfaces for fluid domain extraction and create an additional boundary in a domain. To open the Surface Sets dialog box, do one of the following:
1. Click  Create Fluid Domain > .
Create Fluid Domain > .2. Click in the Faces box. The Surface Sets dialog box opens.
1. In the Flow Analysis Tree, under Domains, select a domain.
2. Click  Add Boundary Condition. The Surface Sets dialog box opens.
Add Boundary Condition. The Surface Sets dialog box opens.• Coordinate System—Select a custom coordinate system to split domains. To open the Coordinate System dialog box, follow the steps listed below:
a. In the Model Tree select a domain.
b. Click  Split Domain. The Split Tool tab opens.
Split Domain. The Split Tool tab opens.c. In the Split type list select Cylinder.
d. In the Coordinate system list select Custom. The Coordinate System dialog box opens. The custom coordinate system is defined.
• Grid Information—View information about the geometry and grid. To open the Grid Information dialog box, click >  Grid Information.
Grid Information.• Material Selection—Assign materials for the fluid and solid domains. Under Value there is a list of fluids and solids and is where you can add new materials. You can then assign the materials to the volumes listed under Fluid Domains and Solid Domains. To open the Material Selection dialog box, click  Materials. The options available in the dialog box are listed below:
Materials. The options available in the dialog box are listed below:◦ Move to fluid/solid—Defines domains as solid or fluid and moves domains between the two categories.
◦ Set material—Defines multiple domains with the same material. Follow the steps listed below:
1. Select multiple domains.
2. Right-click and select Set material.
◦ Force update—Enforces update of material properties for all simulation domains.
• Physical Model Selection—Assign physical modules (link) for the simulation. To open the Physical Model Selection dialog box, click  Physics Module.
Physics Module.• Expression Editor—Add expressions and tables for selected variables. You can use the Expression Editor for any entry field and to create derived variables for output and controlling the viewing window. To open the Expression Editor dialog box, click  Expression Editor.
Expression Editor.Plot Panel
The plot panel displays XY plots of variables for the selected geometric entity.
To open the plot panel, perform the steps listed below:
1. In the Flow Analysis Tree, under Results click Boundaries.
2. Select a boundary.
3. Click  XYPlot. A new entity xyplot1 is added in the Flow Analysis Tree under > > .
XYPlot. A new entity xyplot1 is added in the Flow Analysis Tree under > > .4. Select xyplot1.
5. In the Properties panel, set the Variable.
Activate the output variable before you perform the simulation. |