Varying a Single Variable in a Global Sensitivity Study
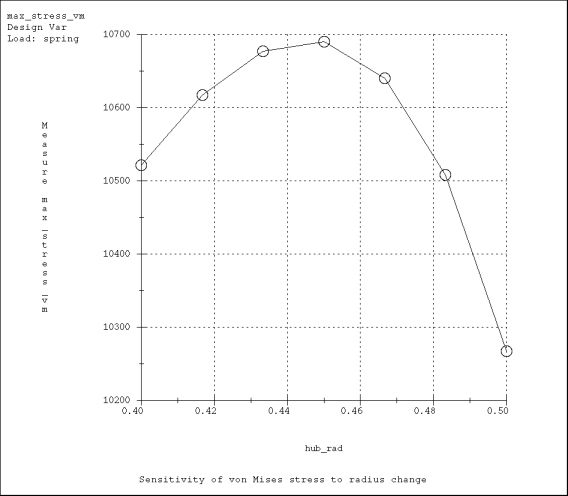
In the following example, the global sensitivity curve plots von Mises stress as a function of change in radius. In this case, the von Mises stress is at a maximum value of approximately 10.69 ksi for a radius of 0.45 inch.
