基礎模型模擬練習 6 - 分析結果
繪製監測點的壓力
1. 在 Flow Analysis 樹中的「邊界條件」(Boundary Conditions) 下,按一下「一般邊界」(General Boundaries)。
2. 選取 Inlet。
3. 按一下  「XY 繪圖」(XYPlot)。系統會在 Flow Analysis 樹中的 > > 底下新增一個新圖元 xyplot1。
「XY 繪圖」(XYPlot)。系統會在 Flow Analysis 樹中的 > > 底下新增一個新圖元 xyplot1。4. 選取 xyplot1。
5. 在「內容」(Properties) 面板中,將「變數」(Variable) 設定為「壓力」(Pressure)。
6. 視需要按一下  「停止」(Stop) 與
  「執行」(Run)。
「停止」(Stop) 與 「執行」(Run)。7. 按一下  「XY 繪圖面板」(XYPlot Panel) 可檢視 XY 繪圖。
「XY 繪圖面板」(XYPlot Panel) 可檢視 XY 繪圖。由於已將出口表壓力設定為 0 Pa,因此沿噴嘴的壓降等於入口壓力,如下圖所示。
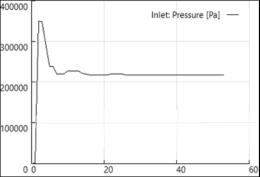
壓降 (Pa) = 220000 Pa
在 X 軸上:迭代
在 Y 軸上:壓力