Motion Analysis
Creo retains a model in the temporary memory until the model is erased, or until the application is closed.
1. With no model open, on the Home tab, click  Erase Not Displayed in the Data group. The Erase Not Displayed dialog box opens.
Erase Not Displayed in the Data group. The Erase Not Displayed dialog box opens.2. Click OK.
4. On the Home tab, click Open. The File Open dialog box opens.
5. Select crankshaft_assembly.asm and click Open.
6. On the in-graphics toolbar, click  Datum Display Filters and clear the Select All check box to clear all the datum display check boxes.
Datum Display Filters and clear the Select All check box to clear all the datum display check boxes.
7. On the Applications tab, click  Mechanism. The Mechanism tab opens.
Mechanism. The Mechanism tab opens.8. Click  Servo Motors from the Insert group. The Motor tab opens.
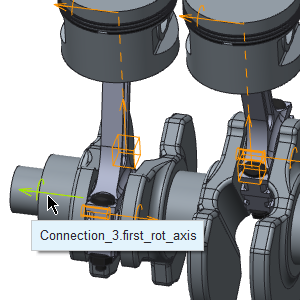
Servo Motors from the Insert group. The Motor tab opens.9. In the graphics window, select Connection_3.first_rot_axis as shown in the following figure.
10. Click the Profile Details tab, and do the following:
a. Under Driven Quantity, click the arrow next to Angular Position and select Angular Velocity.
b. Under Coefficients, change the velocity value to 45.
c. On the Motor tab, click  OK.
OK.
OK.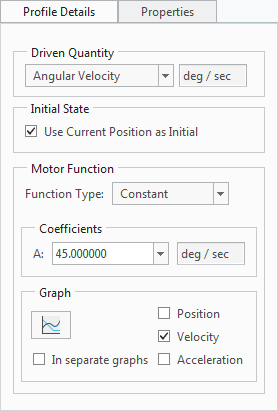
11. On the Mechanism tab, click  Mechanism Analysis in the Analysis group. The Analysis Definition dialog box opens.
Mechanism Analysis in the Analysis group. The Analysis Definition dialog box opens.a. Under Name, type motion.
b. Under Type, select Kinematic.
c. Under Graphical display, change the End Time from 10 to 12.
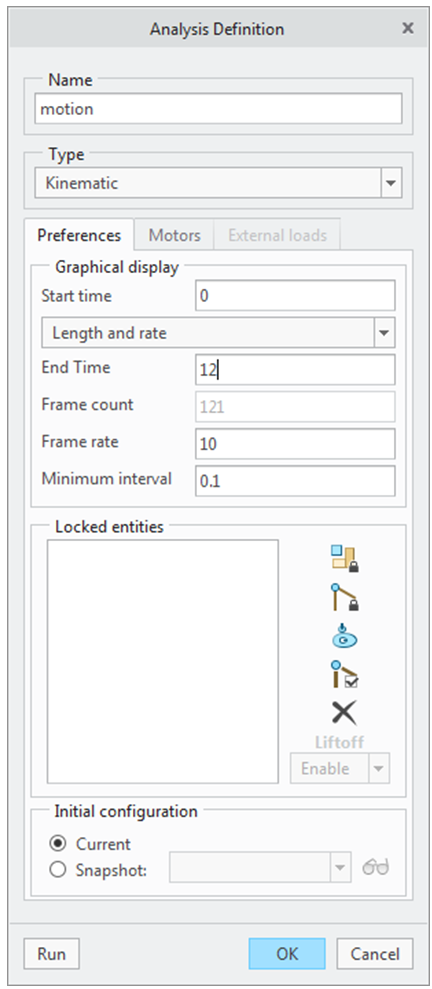
d. Click Run and observe the model.
e. When the kinematic analysis is complete, click OK in the Analysis Definition dialog box.
12. On the Mechanism tab, click  Measures in the Analysis group. The Measure Results dialog box opens.
Measures in the Analysis group. The Measure Results dialog box opens.13. Under Measures, click  . The Measure Definition dialog box opens.
. The Measure Definition dialog box opens.a. Under Name, type V_1.
b. Under Type, select Velocity.
c. Click  and select the connection as shown in the following figure:
and select the connection as shown in the following figure: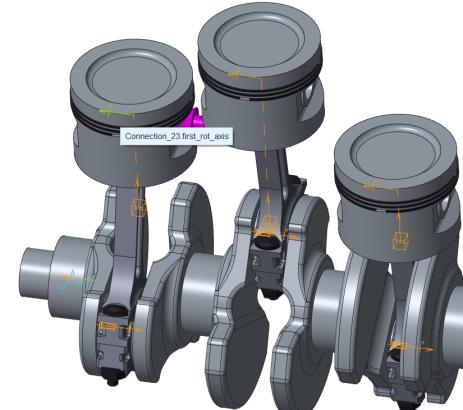
d. Click OK. The Measure Definition dialog box closes.
14. In the Measure Results dialog box, under Measures, click . The Measure Definition dialog box opens.
. The Measure Definition dialog box opens.a. Under Name, type V_2.
b. Under Type, select Velocity.
c. Click and select the connection as shown in the following figure:
and select the connection as shown in the following figure: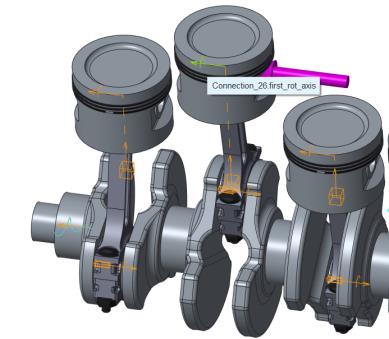
d. Click OK. The Measure Definition dialog box closes.
15. In the Measure Results dialog box, under Measures, click . The Measure Definition dialog box opens.
. The Measure Definition dialog box opens.a. Under Name, type V_3.
b. Under Type, select Velocity.
c. Click and select the connection as shown in the following figure:
and select the connection as shown in the following figure: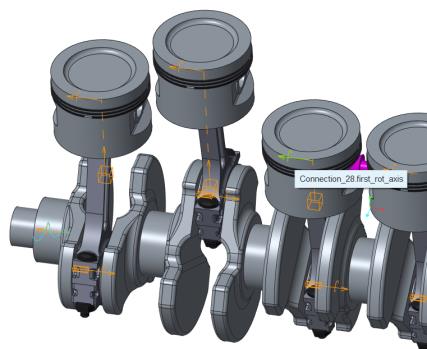
d. Click OK. The Measure Definition dialog box closes.
16. In the Measure Results dialog box, under Result set, click motion.
17. Hold down the CTRL key, and under Measures select V_1, V_2, and V_3.
18. Click  Graph. The motion analysis results appear in the Chart-Tool dialog box.
Graph. The motion analysis results appear in the Chart-Tool dialog box.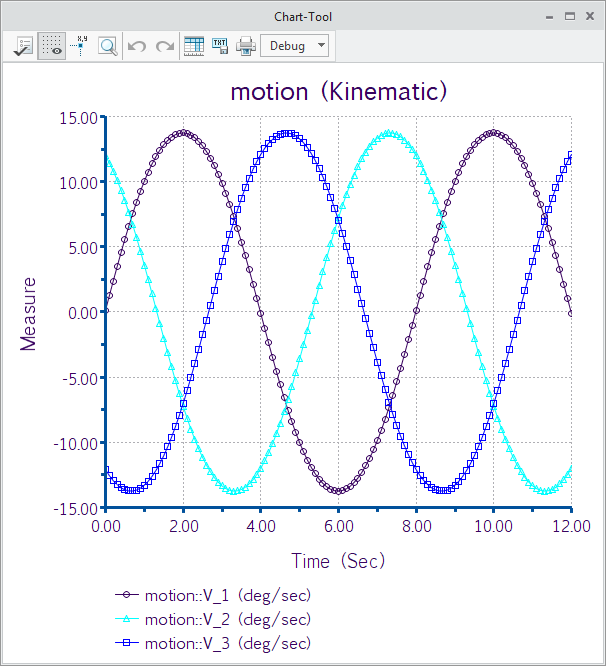
19. Move the Chart-Tool window to the bottom left of the screen.
20. Close the Measure Results dialog box.
21. On the Mechanism tab, click  Playback in the Analysis group. The Playbacks dialog box opens.
Playback in the Analysis group. The Playbacks dialog box opens.a. Click  Play. The Animate dialog box opens.
Play. The Animate dialog box opens.b. Click  Play. The animation plays in the graphics window.
Play. The animation plays in the graphics window.c. Click  Stop to stop the animation.
Stop to stop the animation.d. In the Animation dialog box, click Close.
e. In the Playbacks dialog box, click Close.
22. Close the Chart-Tool window.
23. On the Mechanism tab, click  Close. The Save Playbacks dialog box opens.
Close. The Save Playbacks dialog box opens.24. Click Don't save.
Congratulations! You have completed this exercise.
On the Quick Access toolbar, click  Save and then
  Close in each active window.
Save and then Close in each active window.