Cabin Radiation with Convection and Radiation: Exercise 7—Analyzing Results
This exercise describes how you analyze the results during and after the simulation. To hide CAD surfaces (not the fluid domain), switch between  Flow Analysis Bodies and
  CAD Bodies in the Show group. Click
  XYPlot Panel to view the XY Plot.
Flow Analysis Bodies and CAD Bodies in the Show group. Click XYPlot Panel to view the XY Plot.Viewing the Velocity Contours on Sections
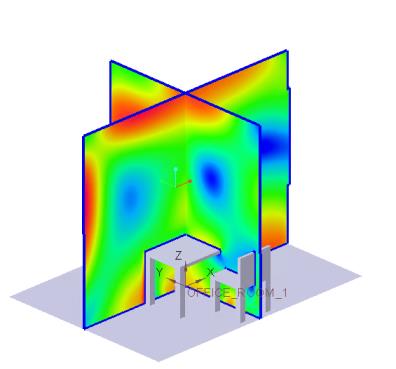 | Velocity Magnitude: [m/s] : Flow 0.2  0.0 |
1. In the Post-processing group, click  Section View and create two sections. Section 01 and Section 02 appear under Derived Surfaces.
Section View and create two sections. Section 01 and Section 02 appear under Derived Surfaces.2. Select Section 01. In the Properties panel, Model tab, set values for the options as listed below:
◦ Type — Plane X
◦ Position — 0
3. Select Section 02. In the Properties panel, Model tab, set values for the options as listed below:
◦ Type — Plane X
◦ Position — 0
4. In the Properties panel, View tab, for Surface, set values for the options as listed below:
◦ Keep drawing — Yes
◦ Variable — Velocity Magnitude: [m/s] : Flow
◦ Min — 0
◦ Max — 0.2
5. In  Boundary Conditions >
  General Boundaries select OFFICE_ROOM_1_FLUID.
Boundary Conditions > General Boundaries select OFFICE_ROOM_1_FLUID.Viewing the Temperature Contours on a Boundary
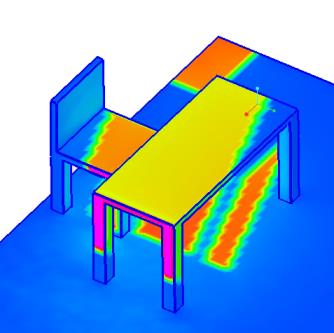 | Velocity Magnitude: [m/s] : Flow 345  295 |
1. In the Properties panel, select the two sections Section 01 and Section 02.
2. In the Properties panel, View tab, for Surface, set Keep drawing to No.
3. In Boundary Conditions > General Boundaries select OFFICE_ROOM_1_FLUID.
Boundary Conditions > General Boundaries select OFFICE_ROOM_1_FLUID.4. In the Properties panel, View tab, for Surface, set values for the options as listed below:
◦ Keep drawing — Yes
◦ Outline — Yes
◦ Variable — Temperature: [K] : Heat
◦ Min — 295
◦ Max — 345
Plotting the Pressure at Monitoring Point
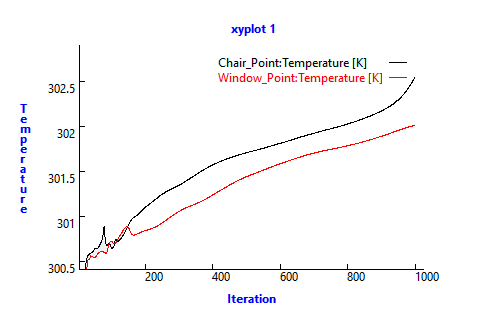
1. In the Flow Analysis Tree, under Results click Monitoring Points.
2. Select Window_Point and Chair_Point.
3. Click  XYPlot. A new entity xyplot1 is added in the Flow Analysis Tree under > > .
XYPlot. A new entity xyplot1 is added in the Flow Analysis Tree under > > .4. Select xyplot1.
5. In the Properties panel, set Variable to Temperature.
6. Click  Stop and
  Run, if required.
Stop and Run, if required.