Querying and Saving Results
Use the simulation probe to view and save result quantities for a simulation study. You can create simulation probes to view the following:
• Value of the displayed result quantity at a particular point, along with the coordinates of the selected location on your model.
• Maximum value of a result quantity for a selected surface, or a top level model.
• Minimum value of a result quantity for a selected surface, or a top level model.
• Graphs of time varying results.
• Result History for structure, modal, steady-state thermal or flow studies.
You can create multiple probes for different quantities in a single simulation study. After you create a probe you can save it with the model.
To Create a Simulation Probe
1. Click  Simulation Probe to open the Simulation Probe dialog box.
Simulation Probe to open the Simulation Probe dialog box.2. Select a point or a surface for which you want to query the result quantity. The selected point or surface appears in the Probed Entity collector.
3. Select one of the following result components:
◦ On Point—View the result quantity at a point along with the coordinates of the point.
◦ Minimum—View the minimum value of the result quantity for a selected surface.
◦ Maximum—View the maximum value of the result quantity for a selected surface.
You can also create a probe for the maximum or minimum value of the top model.
For a simplified lattice you cannot create probes because you cannot select geometry for a simplified lattice. |
4. Click  to view the details of the probe, such as the name of the simulation study, the coordinates of the selected point along with the result quantity, or the maximum or minimum value of the result quantity for a selected surface.
to view the details of the probe, such as the name of the simulation study, the coordinates of the selected point along with the result quantity, or the maximum or minimum value of the result quantity for a selected surface.Click  to minimize the probe.
to minimize the probe.5. For time varying results, such as the results of transient thermal studies or fluid simulation studies click  to view a time dependent graph of the selected quantity for the point or surface.
to view a time dependent graph of the selected quantity for the point or surface.Click  to minimize the display of the graph.
to minimize the display of the graph.6. Click Save, specify a name for the probe and click OK to save the probe and add it to the Model Tree.
Probes are also saved as analyses in the model, and can be retrieved by the following methods:
◦ Click > .
◦ Click > > .
Displaying Result History using Probes
For structure, modal and steady-state thermal and flow studies you can view a basic bar graph of result quantities that vary as a result of input conditions. The X- axis of the graph represents each change in the result quantity, while the Y axis displays a result quantity. To create and view a basic result history graph perform the following steps:
1. Set up a live simulation study.
2. Create a probe for the study.
3. Save the probe. The probe is displayed in the Model Tree and in the graphics window.
4. Click the arrow next to Query and select the Accumulate Data check box.
5. The button is now available on the saved probe in the graphics window.
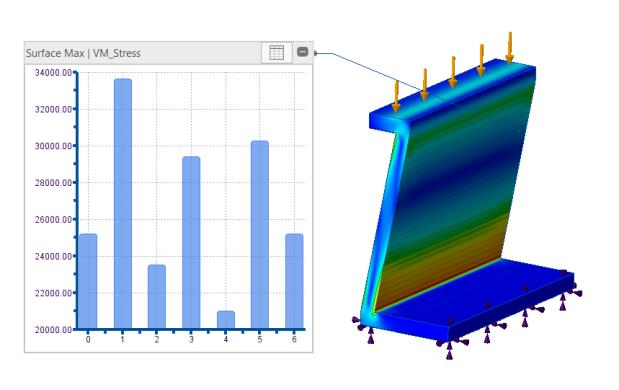
button is now available on the saved probe in the graphics window.6. Click to view the result history for the probed result quantity. For every change in input conditions or geometry, the graph changes.
to view the result history for the probed result quantity. For every change in input conditions or geometry, the graph changes.The following example shows the values of Von Mises stress at a point on the model for different loads. The X- axis represents each change in the result on account of load changes. The Y-axis shows Von Mises stress at a point on the model for each load change.
You can right-click the graph and select Export to Excel or Export to TXT to save the chart values in a spreadsheet or a text file.
By default the Accumulate Data check box is cleared and the graph button is not available on the probe.
is not available on the probe.