Advanced Physics – Cavitation and Multicomponent Mixing
Cavitation Over a Sharp-Edged Orifice
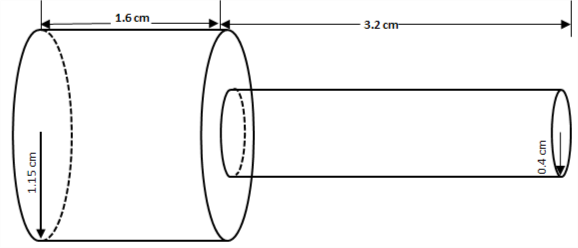
Problem Statement: 3D cavitating flow is modeled over a sharp-edged orifice using the standard k-ε turbulence model and constant gas mass fraction cavitation model.
References: W.H. Nurick, “Orifice Cavitation and Its Effects on Spray Mixing”, Journal of Fluids Engineering, Vol 98, pp. 681-687, 1976.
Fluid Properties | Geometric Properties | Working Conditions |
|---|---|---|
Density = 1000 kg/m3 Viscosity = 0.001 Pa-s Saturation pressure = 3540 Pa | Inlet cylinder Radius = 1.15 cm Length = 1.6 cm Outlet cylinder Radius = 0.4 cm Length = 3.2 cm | Inlet pressure = 250 kPa Outlet pressure = 95 kPa |
Result Comparison – Coefficient of discharge
The coefficient of discharge characterizes the flow and pressure loss behavior of orifices. The computed results from Creo Flow Analysis are compared to the analytical solution.
Results | Analytical | Creo Flow Analysis | % Difference |
|---|---|---|---|
Coefficient of Discharge (Cd) | 0.78 | 0.7822 | 0.28 |
Results – Vapor volume fraction contours

Multicomponent Species Transport in Pipe Flow
Problem Statement: The mixing of two components flowing through a pipe is modeled using the Multicomponent Mixing module. Component A enters the pipe at the inlet. Component B enters through the walls of the pipe.
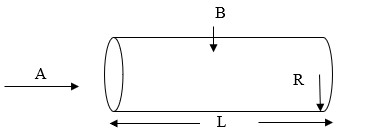
• A = Component A
• B = Component B
References: W.M. Kays and M.E. Crawford. Convective Heat and Mass Transfer. 3rd Edition. McGraw-Hill Book Co., Inc., New York, NY. 126-134. 1993.
Fluid Properties | Geometric Properties | Working Conditions |
|---|---|---|
Component A and B Density = 1 kg/m3 Viscosity = 1 x 10⁻⁵ Pa-s Diffusivity = 1.43 x 10⁻⁵ m2/s | R = 0.0025 m L = 0.5 m | Max inlet velocity = 2 m/s Outlet pressure = 101325 Pa |
Result Comparison – Mass fraction of Component-A across the pipe
Measurements of the mass fraction of Component A along the axis of the pipe indicate the extent of mixing of the components throughout the pipe. The results from Creo Flow Analysis are compared to the analytical solution.
Mass Fraction of Component A | |||
|---|---|---|---|
Axial Coordinate (m) | Analytical Solution | Creo Flow Analysis | % Difference |
0.01 | 1 | 1 | 0 |
0.02 | 0.9999 | 0.9986 | 0.1 |
0.03 | 0.9963 | 0.9882 | 0.8 |
0.04 | 0.9670 | 0.9625 | 0.5 |
0.05 | 0.9230 | 0.8980 | 2.7 |
0.06 | 0.8706 | 0.8720 | 0.1 |
0.07 | 0.8146 | 0.8172 | 0.3 |
0.08 | 0.7583 | 0.7610 | 0.4 |
0.09 | 0.7034 | 0.7054 | 0.3 |
0.1 | 0.6511 | 0.6417 | 1.4 |