Interface for Creo Flow Analysis
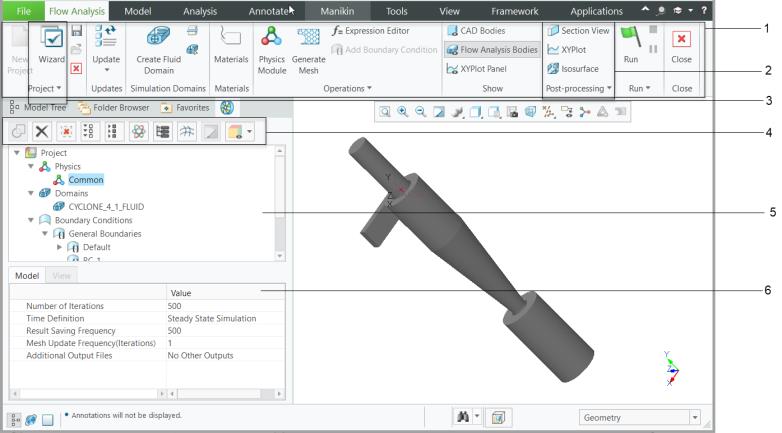
1. Flow Analysis Ribbon
2. Group
3. Wizard
4. Functions Panel
5. Flow Analysis Tree
6. Properties Panel
Flow Analysis Tab
When you open an assembly file, the Flow Analysis tab appears. The Flow Analysis tab contains the options for Flow Analysis to perform the simulation. The options are divided into the groups listed below:
Group | Icon Description |
|---|---|
Project | Create, save, open, close, import, and export projects |
Updates | Update projects or fluid domain, to modify the fluid domain when there are changes made to the CAD model |
Simulation Domains | Create a fluid domain for a CAD geometry, split them and add them as simulation domains to perform calculations |
Materials | Open the Material Selection dialog box |
Operations | Generate the mesh, add physical modules, add boundary conditions, view tessellations in the CAD geometry, and start the expression editor |
Show | Show CAD, Creo Flow Analysis bodies, and XYPlot Panel(Residual Panel) |
Post-processing | Create sections, XY-plots, isosurfaces, streamlines, monitor points, and view grid and geometry related information |
Run | Run, pause, and stop a simulation, control the start point of the simulation, and select steady or transient simulations |
Close | Closes the Flow Analysis tab |
Flow Analysis Tree
The Flow Analysis Tree is organized according to the Flow Analysis workflow. The Flow Analysis Tree provides access to the geometric entities such as CAD surfaces, boundaries, and domains in a project that you can manage for the analysis. The available entities are listed below:
• Physics—Physical modules used in the simulation
• Domains—Fluid domains in the model
◦ Redefine—Opens the Fluid Domain Creation tab where you redefine the domain.
◦ Add Boundary Condition—Adds a boundary. Opens the Surface Sets dialog box where, under Included Surfaces, you select the surfaces for a boundary
◦ Remove—Deletes the domain.
• Boundary Conditions—Boundaries of the fluid domain under General Boundaries
• Results—Entities created after meshing, and for postprocessing
◦ Derived Surfaces—Lists the created sections and isosurfaces
◦ XY Plots—Displays the quantitative results of the simulation
◦ Monitoring Points—Records variables or properties data at a specific location
◦ Streamlines—Tracks the path of flow
◦ Particles—Tracks particles of flow or particles moving with the flow
Functions Panel
From the Functions panel you can control the entities and your view of the entities in the Flow Analysis Tree.
Icon | Description |
|---|---|
 | Connects two boundaries to create the mismatched grid interface (MGI) |
 | Deletes the selected geometric entity |
 | Turns off the display of the selected entity and reverts to the display of all entities |
 | Expands categories under the Flow Analysis Tree and displays all the entities |
 | Displays only the categories under the Flow Analysis Tree and hides all the entities under them |
 | Switches the display of CAD and simulation geometry |
 | Switches the view of the grouping for geometric entities. You can view as a hierarchy based on volumes or as independent categories, based on type. |
 | Switches between turning off and turning on the global display of all surfaces, grids, and outlines. |
Properties Panel
The Properties panel contains information about geometric entities and physical modules. The parameters and conditions on the Properties panel depend on your selection in the Flow Analysis Tree. This panel contains the Model tab and the View tab.
• Model Tab
◦ Mesh-related parameters—Appear when you click Domains in the Flow Analysis Tree.
◦ Physical module-related parameters—Conditions related to the physics being studied. Parameters vary according to the selection in the Flow Analysis Tree:
▪ Numerics, convergence, and more options appear when you select a module under Physics.
▪ Boundary conditions appear when you select a boundary under General Boundaries.
▪ Interface and MGI-related options appear when you select the entity under Boundary Conditions
▪ Volume-related conditions appear when you select a fluid domain under Domains.
• View Tab—Contains parameters to change the display in the Display window.
◦ Surface—Displays the primary variables (such as pressure, velocity or temperature), physical properties (such as density, viscosity), or derived variables (such as total pressure, velocity magnitude, enthalpy) when you select boundaries, derived surfaces, interfaces, CAD surfaces, and volumes. The options available under Surface are listed below:
▪ Keep drawing—Displays the surface of the boundaries, derived surfaces, interfaces, CAD surfaces, and volumes.
▪ Grid—Displays the grid (mesh) on boundaries, derived surfaces, interfaces, CAD surfaces, and volumes.
▪ Outline—Displays the outline on boundaries, derived surfaces, interfaces, CAD surfaces, and volumes.
▪ Number of Colors—Specifies the number of legend colors.
▪ Show values—Displays all values in the legend.
▪ Smooth Color Map—Changes display mode of the color bar.
▪ Local Range—Sets the color map range based on the local values in the entity.
▪ Min and Max—Adjusts the bounds for the color bar for contours.
◦ Vector—Displays vectors on boundaries, derived surfaces, interfaces, CAD surfaces, and volumes. The options available under Vector are listed below:
▪ Color By Function—Select a primary variable, physical property, or derived variables for display on the vectors.
▪ Color—Select a legend to associate with the display variable.
▪ Size—Controls the size of the vectors. These are also controlled by the slider bar.
▪ Uniform Head—Switch between uniform head size and head size depending on the vector magnitude.
▪ Head Size—Manually change the vector head size depending on your input.
▪ Projection—Project the vectors onto the selected surface.
Dialog Boxes for Creo Flow Analysis
• Domain Model Selection—Select the fluid and solid components or domains for the simulation from the Model Tree.
To open the Domain Model Selection dialog box, click  Select Simulation Domains.
Select Simulation Domains.To add the fluid component, follow the steps listed below:
1. Click Add fluid domain.
2. In the Model Tree, select the fluid part. This is the .PRT file.
3. Middle-click to confirm. The fluid component is added under Fluid Components.
4. Click OK.
To add the solid component, click Add solid component and follow steps 2,3,4.
• Surface Sets—Select surfaces for fluid domain extraction and create an additional boundary in a domain. To open the Surface Sets dialog box, do one of the following:
1. Click  Create Fluid Domain > .
Create Fluid Domain > .2. Click in the Faces box. The Surface Sets dialog box opens.
1. In the Flow Analysis Tree, under Domains, select a domain.
2. Click  Add Boundary Condition. The Surface Sets dialog box opens.
Add Boundary Condition. The Surface Sets dialog box opens.• Coordinate System—Select a custom coordinate system to split domains. To open the Coordinate System dialog box, follow the steps listed below:
1. In the Model Tree select a domain.
2. Click  Split Domain. The Split Tool tab opens.
Split Domain. The Split Tool tab opens.3. In the Split type list select Cylinder.
4. In the Coordinate system list select Custom. The Coordinate System dialog box opens. The custom coordinate system is defined.
• Grid Information—View information about the geometry and grid. To open the Grid Information dialog box, click >  Grid Information.
Grid Information.• Material Selection—Assign materials for the fluid and solid domains. Under Value there is a list of fluids and solids and is where you can add new materials. You can then assign the materials to the volumes listed under Fluid Domains and Solid Domains. To open the Material Selection dialog box, click  Materials. The options available in the dialog box are listed below:
Materials. The options available in the dialog box are listed below:◦ Move to fluid/solid—Defines domains as solid or fluid and moves domains between the two categories.
◦ Set material—Defines multiple domains with the same material. Follow the steps listed below:
1. Select multiple domains.
2. Right-click and select Set material.
◦ Force update—Enforces update of material properties for all simulation domains.
• Physical Model Selection—Assign physical modules (link) for the simulation. To open the Physical Model Selection dialog box, click  Physics Module.
Physics Module.• Expression Editor—Add expressions and tables for selected variables. You can use the Expression Editor for any entry field and to create derived variables for output and controlling the viewing window. To open the Expression Editor dialog box, click  Expression Editor.
Expression Editor.Plot Panel
The plot panel displays XY plots of variables for the selected geometric entity.
To open the plot panel, perform the steps listed below:
1. In the Flow Analysis Tree, under Results click Boundaries.
2. Select a boundary.
3. Click  XYPlot. A new entity xyplot1 is added in the Flow Analysis Tree under > > .
XYPlot. A new entity xyplot1 is added in the Flow Analysis Tree under > > .4. Select xyplot1.
5. In the Properties panel, set the Variable.
Activate the output variable before you perform the simulation. |