Melt Front Time Result
You should focus on the color gradient of the melt front time result. A drastic color change in a region means that the flow speed is lower than in other area. An optimized Melt Front Time result shows a balanced flow contribution of each gate. All flow paths reach the cavity wall at the same time. You can identify the following issues from the Melt Front Time result:
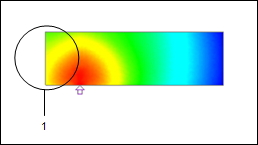
• Hesitation—A drastic color change in the region indicates a low flow speed in the cavity causing flow hesitation. In extreme cases, hesitation may lead to hesitation mark on part surface or even short shot.
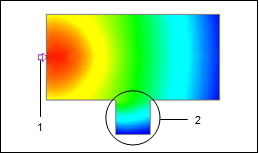
1. Gate
2. Region of hesitation
• Weld line—Weld line is formed when two different melt fronts join at a sharp angle during the filling process. A weld line decreases the strength of the final product and produces surface defects.
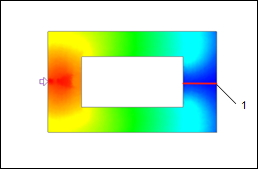
1. Weld line
• Air Trap—An air trap is formed by converging melt fronts that trap a small bubble of air. It may occur at multiple locations inside the cavity.
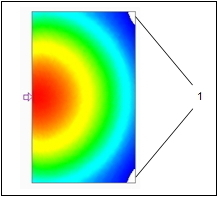
1. Air trap
• Short shot—The model is not completely filled at the end of filling which may cause short shot.
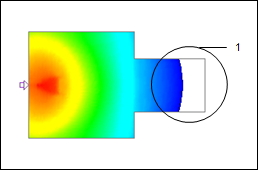
1. Short shot
• Overpacking—Some flow paths are filled completely before others. These filled flow paths keep being filled with extra plastic melt until the entire cavity is filled. The condition of the flow paths being overfilled is called overpacking.
1. Region of overpacking
• Racetrack effect—The plastic melt travels at different speeds in each flow path. A thicker wall region has low flow resistance than the thinner wall region, so the melt tends to flow faster in the thicker wall region. If the flow path is long, backfilling into thinner region may occur. The backfilling may cause air traps and weld lines. The following image shows the racetrack effect. The front view shows the speed difference of the melt front. The side view shows the thickness distribution of the model.
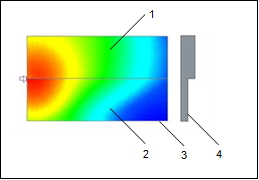
1. Region of low flow resistance
2. Region of high flow resistance
3. Front view
4. Side view