Types of Tolerance Stackup Analyses
EZ Tolerance Analysis supports worst-case, Root Sum of the Squares (RSS), and general statistical analysis methods. RSS is a special case of the general statistical analysis method and therefore covered in the Statistical Analysis section.
Worst-Case Tolerance Analysis
Worst-case tolerance analysis is a traditional tolerance stackup calculation. The individual variables are placed at their limits to make the stackup distance as large or as small as possible.
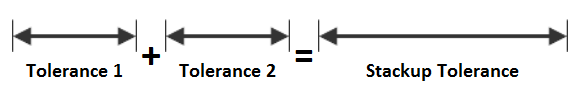
In the worst-case method, the distribution of the individual variables is not considered. Instead, it is assumed that all parts are produced at their extreme limit of acceptability and assembled together in the same assembly unit. This method helps to predict the absolute upper and lower limits of the stackup distance that can be achieved with all acceptable parts. Designing to meet the worst-case tolerance requirements, requires that all parts produced to their extreme limits assemble and function.
Assigning a tolerance that meets the worst-case analyses method is often required for critical mechanical interfaces and spare-part replacement interfaces. The worst-case model often requires close-fitting individual component tolerances resulting in expensive manufacturing and inspection processes and higher scrap rates.
Statistical Analysis
The statistical analysis method takes advantage of the principles of statistics to relax the component tolerances without sacrificing quality. Each contributing dimension is assumed to have a statistical distribution. These distributions are combined to predict the distribution of the assembly stackup distance. Statistical analysis therefore predicts a distribution of the stackup distance instead of the possible extreme limits that the worst-case method determines. This analysis model provides increased design flexibility to design to any quality level, not just 100 percent. Nor does this analysis model assume that the assembly quality level must be the same as the part quality level—a fundamental assumption of the RSS method described below.
The standard deviation calculated for the normal distribution of each dimension is calculated from the following formula for Cp:

Solving for the standard deviation yields:
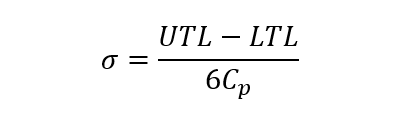
The most common assumption of Cp=1.0 stems from the assumption that manufacturing will select a manufacturing process that will place the defined tolerances at +/- 3 standard deviations from center of the tolerance zone, assumed to be the mean, so that the probability of a part complying to the required tolerances is 99.7%. For all statistical analyses EZ Tolerance Analysis assumes that manufacturing will target the midpoint of the tolerance range, and the mean is assumed to be the midpoint of the tolerance range.
RSS
Root Sum of the Squares, or RSS, analysis leverages the principals of the general statistical analysis method described above but with some simplifying assumptions for calculations with tolerances instead of standard deviations. One of the primary assumptions is that the ratios of each of the tolerances to their associated standard deviations on the dimensions and the stackup result, are the same. For an RSS analysis EZ Tolerance Analysis assumes a Cp of 1.0 for all dimensions and the resulting stackup limits.