Example: Using the Pareto Method
You can apply the Pareto method to optimize multiple variables with contracting conditions. The graphic illustration of the solution results is a set of points in the n-dimensional coordinate system (where n is the number of design variables designated for the analysis).
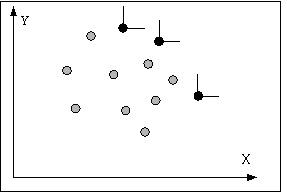
This example illustrates how the Pareto method is used to optimize two design goals, Goal 1 and Goal 2, and find experiments that yield maximum values for both design goals. In the graph, the x-axis shows values for Goal 1, and the y-axis shows values for Goal 2. Each point in the graph represents a record of an experiment.
Using the Pareto method, the system starts comparing records, trying to find maximum values for both design goals. As a result of this analysis, all experiments shown as gray points are filtered out because their results are worse than those shown as black points. The three best experiments (shown as black points) represent optimal solutions—they are all acceptable and none of them is better than the other ones.
