旋風分離器練習 7 - 分析結果
本練習說明如何在模擬期間和之後分析結果。欲隱藏 CAD 曲面 (而非流體域),請在  「CAD 主體」(CAD Bodies) 與
  「流動分析主體」(Flow Analysis Bodies) 之間切換。按一下
  「XY 繪圖面板」(XYPlot Panel) 可檢視 XY 繪圖。
「CAD 主體」(CAD Bodies) 與 「流動分析主體」(Flow Analysis Bodies) 之間切換。按一下 「XY 繪圖面板」(XYPlot Panel) 可檢視 XY 繪圖。檢視邊界上的壓力輪廓
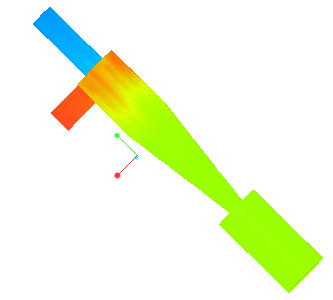 | 壓力: [Pa] : 流量 101350 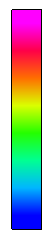 101320 |
1. 在「邊界條件」(Boundary Conditions) 中的「一般邊界」(General Boundaries) 下,選取 CYCLONE_4_FLUID_1:Body 1。
2. 在「內容」(Properties) 面板的「檢視」(View) 標籤中的「曲面」(Surface) 底下,為所列選項選取以下值:
◦ 「保留工程圖」(Keep drawing) -「是」(Yes)
◦ 「格點」(Grid) -「否」(No)
◦ 「輪廓」(Outline) -「否」(No)
◦ 「變數」(Variable) -「壓力:[Pa]:流量」(Pressure: [Pa] : Flow)
◦ 「最小」(Min) - 101320
◦ 「最大」(Max) - 101350
在領域中檢視簡化
 | 速度量值: [m/s]: 流量 5.95  0 |
1. 在「後處理」(Post-processing) 群組中,按一下  「流線」(Stream Lines)。在
  「結果」(Results) > 「流線」(Streamlines) 下,選取 Streamline 01。Streamline 01「內容」(Properties) 對話方塊即會開啟。
「流線」(Stream Lines)。在 「結果」(Results) > 「流線」(Streamlines) 下,選取 Streamline 01。Streamline 01「內容」(Properties) 對話方塊即會開啟。2. 在「內容」(Properties) 面板的「模型」(Model) 標籤中,針對所列選項選取以下值:
◦ 「線條粗細」(Line Thickness) - 0.007
◦ 「動畫時間大小」(Animation Time Size) - 0.0001
3. 在「內容」(Properties) 面板的「檢視」(View) 標籤中的「曲面」(Surface) 底下,為所列選項選取以下值:
◦ 「變數」(Variable) -「速度量值:[m/s]:流量」(Velocity Magnitude: [m/s] : Flow)
◦ 「最小」(Min) - 0.0
◦ 「最大」(Max) - 5.95
4. 在 Flow Analysis 樹中的「一般邊界」(General Boundaries) 底下選取 BC_00002。
5. 在「內容」(Properties) 面板的「模型」(Model) 標籤中,針對「簡化」(Streamline),將「釋放粒子」(Release Particle) 設定為 Yes。
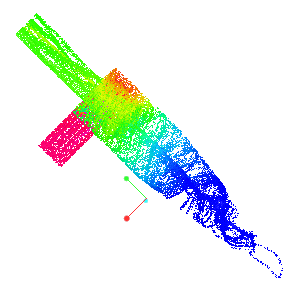
以低於 1 m/s 的速度檢視點的等值曲面
 | 速度量值: [m/s]: 流量 1.0  0.00000 |
1. 按一下  Flow Analysis >
  「等值曲面」(Isosurface)。系統會在 Flow Analysis 樹中的「衍生曲面」(Derived Surfaces) 底下顯示一個新圖元 Isosurface 01。
Flow Analysis > 「等值曲面」(Isosurface)。系統會在 Flow Analysis 樹中的「衍生曲面」(Derived Surfaces) 底下顯示一個新圖元 Isosurface 01。2. 選取 Isosurface 01。
3. 在「內容」(Properties) 面板的「模型」(Model) 標籤中,將選項設定為如下所列的值:
◦ 「等值曲面變數」(Isosurface Variable) -「速度量值:[m/s]:流量」(Velocity Magnitude: [m/s] : Flow)
◦ 「類型」(Type) -「低於值」(Below Value)
◦ 「值」(Value) - 1.0
4. 在「內容」(Properties) 面板的「視圖」(View) 標籤中,針對「曲面」(Surface) 將選項設定為如下所列的值:
◦ 「變數」(Variable) -「速度量值:[m/s]:流量」(Velocity Magnitude: [m/s] : Flow)
◦ 「最小」(Min) - 0.0
◦ 「最大值」(Max) - 1.0
繪製出口邊界處的質量通量
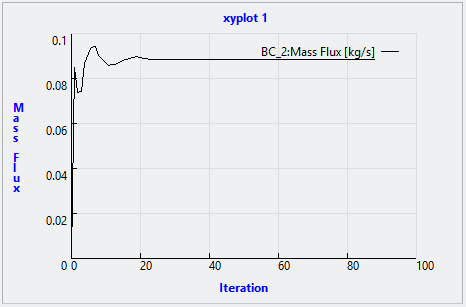
1. 在 Flow Analysis 樹中的「結果」(Results) 底下,按一下「邊界」(Boundaries)。
2. 選取 BC_00002。
3. 按一下  「XY 繪圖」(XYPlot)。系統會在 Flow Analysis 樹中的xyplot1 > > 。
「XY 繪圖」(XYPlot)。系統會在 Flow Analysis 樹中的xyplot1 > > 。4. 選取 xyplot1。
5. 在「內容」(Properties) 面板的「檢視」(View) 標籤中,將「變數」(Variable) 設定為「質量通量」(Mass Flux)。
6. 視需要按一下  「停止」(Stop) 與
  「執行」(Run)。
「停止」(Stop) 與 「執行」(Run)。繪製監測點的壓力
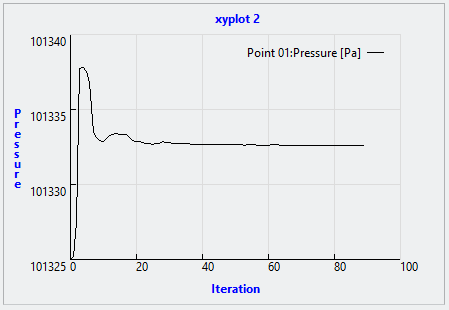
1. 在 Flow Analysis 樹中的「結果」(Results) 底下,按一下「監測點」(Monitoring Points)。
2. 選取 Point01。
3. 按一下 「XY 繪圖」(XYPlot)。系統會在 Flow Analysis 樹中的xyplot2 > > 。
「XY 繪圖」(XYPlot)。系統會在 Flow Analysis 樹中的xyplot2 > > 。4. 選取 xyplot2。
5. 在「內容」(Properties) 面板的「檢視」(View) 標籤中,將「變數」(Variable) 設定為「壓力」(Pressure)。
6. 視需要按一下 「停止」(Stop) 與 「執行」(Run)。
「停止」(Stop) 與 「執行」(Run)。