Multiphase Flow for a Fuel Tank: Exercise 8—Analyzing Results
This exercise describes how you analyze the results during and after the simulation. To hide CAD surfaces (not the fluid domain), switch between  Flow Analysis Bodies and
  CAD Bodies in the Show group. Click
  XYPlot Panel to view the XY Plot.
Flow Analysis Bodies and CAD Bodies in the Show group. Click XYPlot Panel to view the XY Plot.Plotting the Mass Flux at the Inlet and Outlet Boundary
1. Under Domains select TANK.
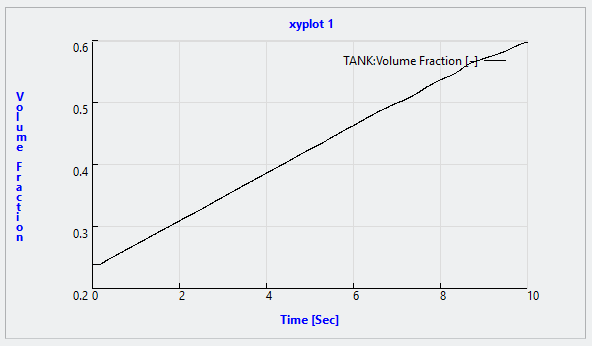
2. Click  XYPlot. A new entity xyplot1 is added in the Flow Analysis Tree under > > .
XYPlot. A new entity xyplot1 is added in the Flow Analysis Tree under > > .3. Select xyplot1.
4. In the Properties panel, Model tab, set the Variable to Volume Fraction. The plot, as shown above, displays the volume fraction of the fuel filling the tank.
Plotting the Volume Fraction at a Section
 | Volume Fraction: fuel [-]: Component 1.0  0.0 |
1. In the Flow Analysis Tree, under Results click Derived Surfaces.
2. Select Section 01.
3. In the Properties panel, Model tab, set values for the options as listed below:
◦ Type—Plane Y
◦ Position— –2.615(minus 2.615)
4. In the Properties panel, View tab, for Surface set values for the options as listed below:
◦ Keep drawing —Yes
◦ Grid—No
◦ Outline—Yes
◦ Variable—Volume Fraction: fuel [-]: Component
Viewing an Isosurface of Points with Velocity Less Than 1 m/s

1. In the Post-processing group click  Isosurface. A new entity Isosurface 01 appears under Derived Surfaces in the Flow Analysis Tree.
Isosurface. A new entity Isosurface 01 appears under Derived Surfaces in the Flow Analysis Tree.2. Select Section 01.
3. In the Properties panel, View tab, set values for the options as listed below:
◦ Keep drawing —No
◦ Grid—No
◦ Outline—No
4. Select Isosurface 01.
5. In the Properties panel, Model tab, set values for the options as listed below:
◦ Isosurface Variable—Volume Fraction: fuel [-]: Component
◦ Type—Above Value
◦ Value—0.5
6. In the Properties panel, View tab, for Surface set a color of your choice and set Outline to No.