Mixing Tank: Exercise 7—Analyzing Results
This exercise describes how you analyze the results during and after the simulation. To hide CAD surfaces (not the fluid domain), switch between  Flow Analysis Bodies and
  CAD Bodies in the Show group. Click
  XYPlot Panel to view the XY Plot.
Flow Analysis Bodies and CAD Bodies in the Show group. Click XYPlot Panel to view the XY Plot.Viewing the Species Concentration on a Section
1. Under  Results >
  Derived Surfaces, select Section 01.
Results > Derived Surfaces, select Section 01.2. In the Properties panel, View tab, for Surface, set values for the options as listed below:
◦ Keep drawing — Yes
◦ Grid — No
◦ Outline — No
◦ Variable — Concentration:01 [-] : Species
◦ Min — 0
◦ Max — 1
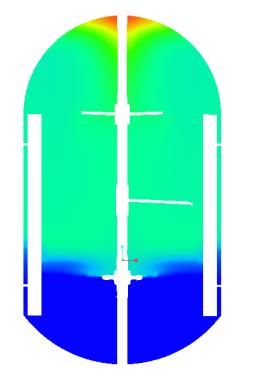 | Concentration:01 [-] : Species 1  0 |
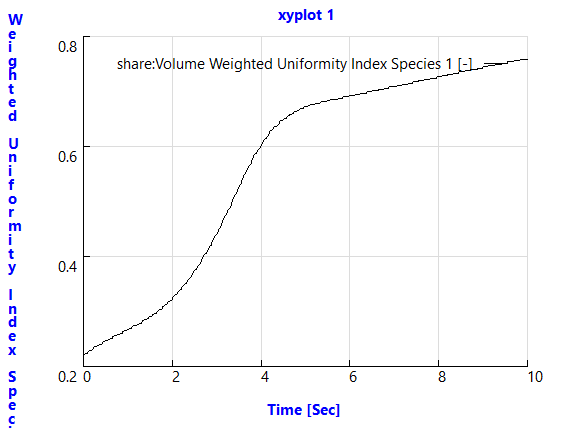
Plotting the Uniformity Index
1. In the Flow Analysis Tree, click Common under Physics.
2. Click  XYPlot. A new entity xyplot1 is added in the Flow Analysis Tree under Results > Derived Surfaces > XY Plots.
XYPlot. A new entity xyplot1 is added in the Flow Analysis Tree under Results > Derived Surfaces > XY Plots.3. Select xyplot1.
4. In the Properties panel, set the Variable as Volume Weighted Uniformity Index Species 1.
Viewing the Animation
1. Click  in the Graphics toolbar to display the style elements. Select
  No Hidden,
  Hidden Line, or
  Wireframe to display the mesh.
in the Graphics toolbar to display the style elements. Select No Hidden, Hidden Line, or Wireframe to display the mesh.2. Clear CAD Bodies.
CAD Bodies.3. In the Flow Analysis Tree under Results > Derived Surfaces, select Section01.
Results > Derived Surfaces, select Section01.4. In the Properties panel, View tab, for Surface, set values for the options as listed below:
◦ Variable — Concentration:01 [-] : Species
◦ Min — 0
◦ Max — 1
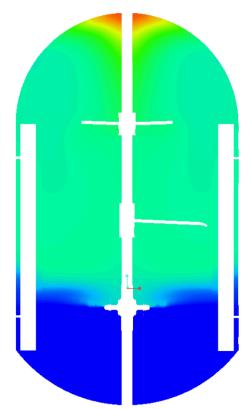 | Concentration:01 [-] : Species 1 0 |
5. In the Flow Analysis tab, click the Project group arrow.
6. Select Save Animation. The Animation Preview dialog box opens.
7. Click  Load Results.
Load Results.8. Press Shift and select a range of result files or files that have the extension .sres. The result files saved depend on the Result Saving Frequency that you set for the Common module.
9. Click Open.
10. In the Animation Preview dialog box, click Save Animation. The animation file is saved in the gif format in the working folder.