Cyclone Separator with Particle Separation: Exercise 7—Analyzing Results
This exercise describes how you analyze the results during and after the simulation. To hide CAD surfaces (not the fluid domain), switch between  Flow Analysis Bodies and
  CAD Bodies in the Show group. Click
  XYPlot Panel to view the XY Plot.
Flow Analysis Bodies and CAD Bodies in the Show group. Click XYPlot Panel to view the XY Plot.Viewing the Pressure Contours on a Boundary
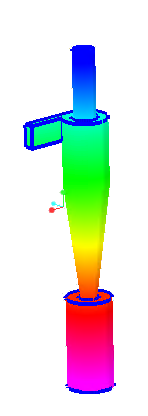 | Pressure: [Pa] : Flow 35.0  0.0 |
1. In  Boundary Conditions >
  General Boundaries select CYCLONE_4_FLUID_1:Body 1.
Boundary Conditions > General Boundaries select CYCLONE_4_FLUID_1:Body 1.2. In the Properties panel, View tab, for Surface, set values for the options as listed below:
◦ Keep drawing — Yes
◦ Grid — No
◦ Outline — No
◦ Variable — Pressure: [Pa] : Flow
◦ Min — 0
◦ Max — 35
Viewing the Velocity Contours on a Boundary
 | Velocity Magnitude: [m/s] : Flow 2.646 0.0 |
1. Create a section.
2. Select Section 01.
3. In the Properties panel, Model tab, set values for the options as listed below:
◦ Type — Plane X
◦ Position — 0
4. In the Properties panel, View tab, for Surface, set values for the options as listed below:
◦ Keep drawing — Yes
◦ Grid — No
◦ Outline — Yes
◦ Variable — Velocity Magnitude: [m/s] : Flow
Viewing the Particles in a Domain
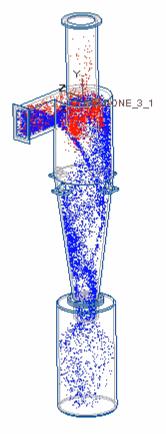
1. In the Flow Analysis Tree, select Particle.
2. In the Properties panel, Model tab, set Particle Size Scale (view only) to 750
3. In the Properties panel, View tab, for Surface, set values for the options as listed below:
◦ Keep drawing — Yes
◦ Color — RGB(255,0,0)
4. In the Flow Analysis Tree, select Particle01.
5. In the Properties panel, Model tab, set Particle Size Scale (view only) to 8
6. In the Properties panel, View tab, for Surface, set values for the options as listed below:
◦ Keep drawing — Yes
◦ Color — RGB(0,0,255)
7. Click  in the Graphics toolbar to display the style elements. Select
  Hidden Line.
in the Graphics toolbar to display the style elements. Select Hidden Line.Plotting the Mass Flux at the Outlet Boundary
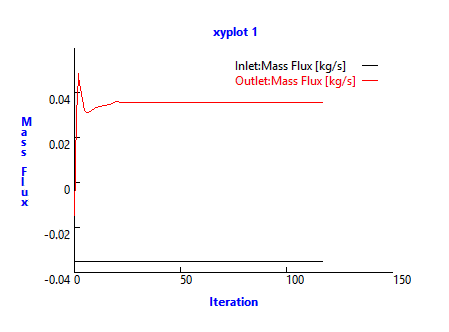
1. In the Flow Analysis Tree, under Boundary Conditions > General Boundaries.
Boundary Conditions > General Boundaries.2. Select Inlet and Outlet.
3. Click  XYPlot. A new entity xyplot1 is added in the Flow Analysis Tree under > > .
XYPlot. A new entity xyplot1 is added in the Flow Analysis Tree under > > .4. Select xyplot1.
5. In the Properties panel, set the Variable as Mass Flux.
6. Click  Stop and
  Run, if required.
Stop and Run, if required.Plotting the Pressure at Monitoring Point
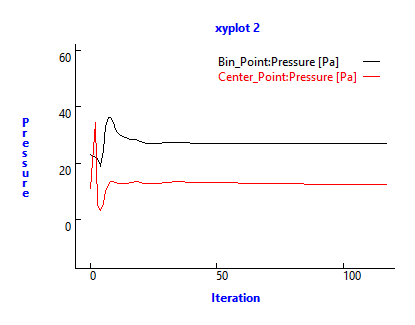
1. In the Flow Analysis Tree, under Results click Monitoring Points.
2. Select Center_Point.
3. Click XYPlot. A new entity xyplot2 is added in the Flow Analysis Tree under > > .
XYPlot. A new entity xyplot2 is added in the Flow Analysis Tree under > > .4. Select xyplot2.
5. In the Properties panel, set Variable to Pressure.
6. Click Stop and Run, if required.
Stop and Run, if required.