Example: Structural Simulation
This example demonstrates how live structural simulation can be used to improve the design of a part by running live simulation, studying the results, and iteratively modifying the design.
The aim of this structural simulation is to limit the allowed stress in the model to 10 MPa. A fixed constraint is applied to the base of the part, and a load of 100 lbf is applied in the negative Y- direction on the upper surface of the model.
|
Design Step
|
Model
|
Live Simulation Results
|
|---|---|---|
|
Run live simulation on the initial part.
|
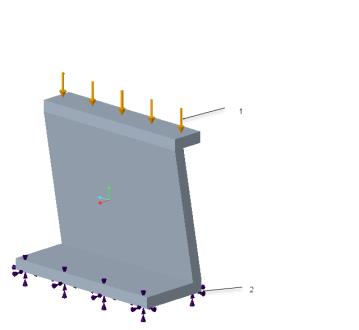 1. Force —100lbf applied on upper surface 2. Fixed constraint on lower surface. |
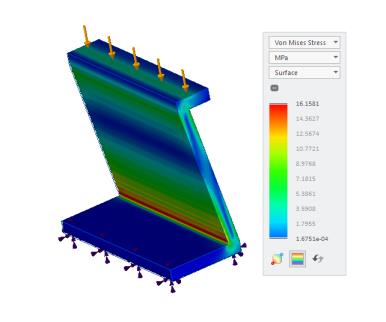 The initial value of Von Mises stress in the model is approximately 16.1 MPa. The red band displays the area with the highest stress concentration. |
|
Round one of the edges that shows high stress.
|
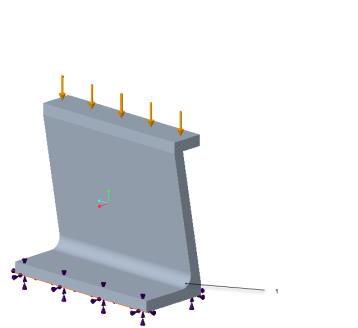 1. Applied round to an edge that shows the highest concentration of stress. |
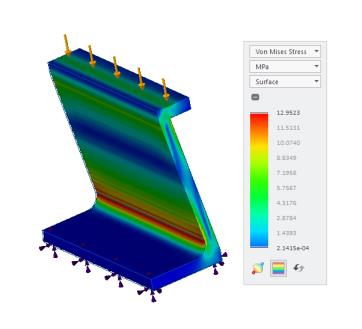 The value of stress is close to 12.9 MPa. |
|
Add chamfer to an edge that shows high stress.
|
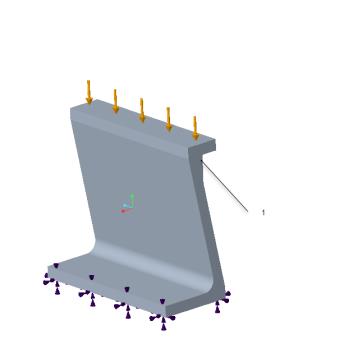 1. Added chamfer to an edge that displays high stress results. |
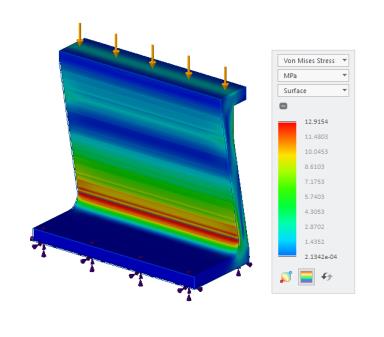 The value of stress is 12.9 MPa. |
|
Add a pattern of support ribs to reduce the stress in the model.
|
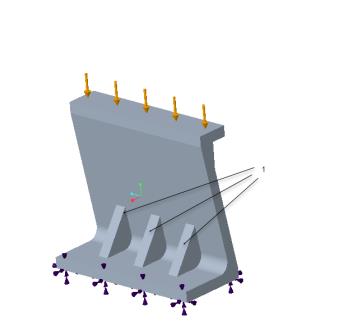 1. Added a pattern of support ribs to reduce stress in the lower region of the model. |
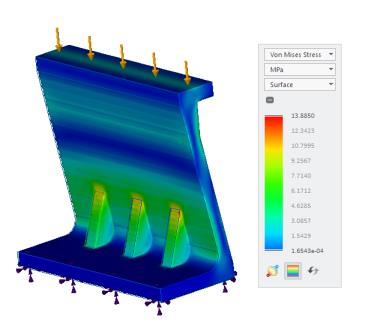 The value of stress is 13.8 MPa. |
|
Increase the height of support ribs to reduce the stress in the model.
|
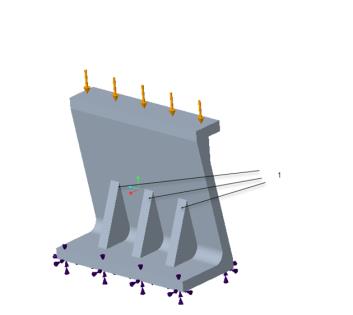 1. Increased the height of the support ribs. |
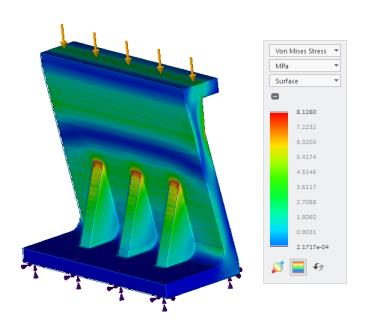 The value of stress is now close to 8 MPa which is within the allowed limits. |