Example: Results with Different Rendering Methods
Depending on which part of the model you are interested in viewing and the result quantity, you can select different rendering methods. The following examples how the results appear when different rendering methods are selected:
|
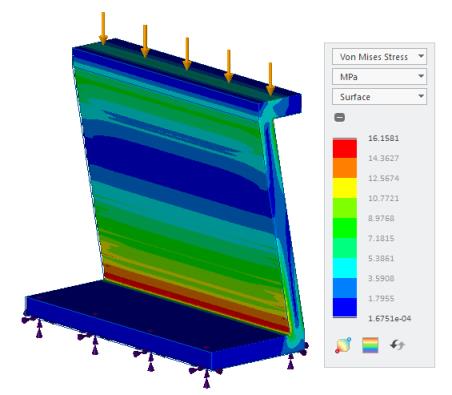
Surface—Shows the results of a structural simulation, on the surface of the model.
|
 |
|
Composite—This result rendering method sums up the results through the model and colors them according to the legend. You can look at only the values you are interested in and only in the areas of interest in the model.
|
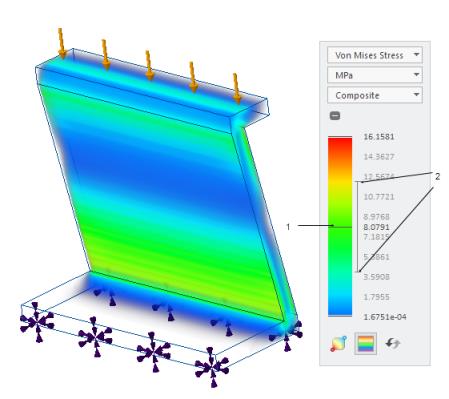 1. Move slider up or down to change the central value of the range of results you are interested in. You can also double-click and specify the central value. 2. Move slider to change the range of results you are interested in. The range changes by the same amount on each side of the central value. |
|
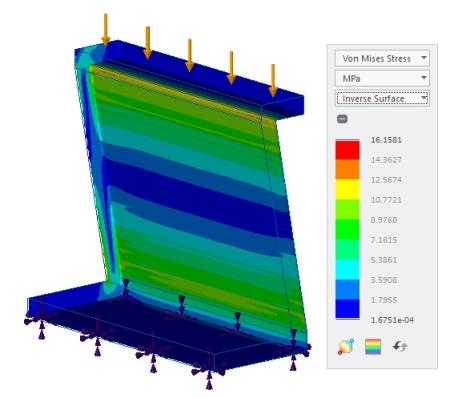
Inverse Surface—Shows the results on the opposite side of the surface display. Think of it as flipping the surface normal direction. Inverse surface has the normal pointing inward as opposed to outward for surface.
|
 |
|
Iso-Surface—Displays a surface that is formed by creating a surface that passes through all the points in the model that have the same result value. This value is called the isovalue. Move the slider to change the isovalue and view iso-surfaces formed for different result values.
|
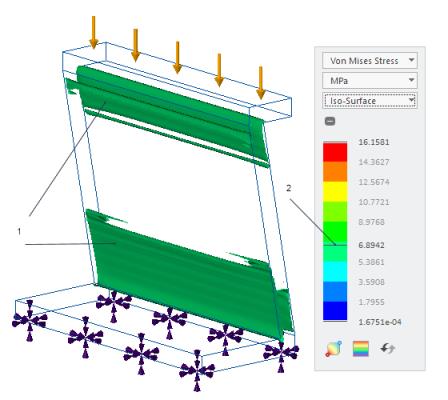 1. Iso-surface 2. Move slider or double-click and specify an isovalue. |
|
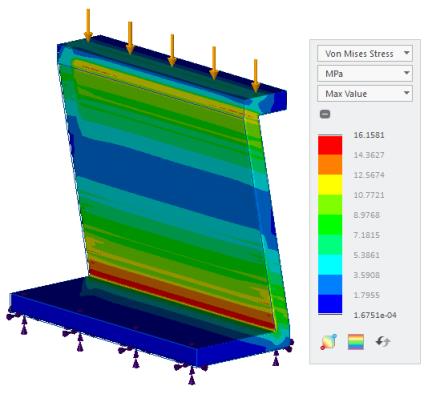
Max Value—Displays the highest value of a result quantity in the model.
|
 |
|
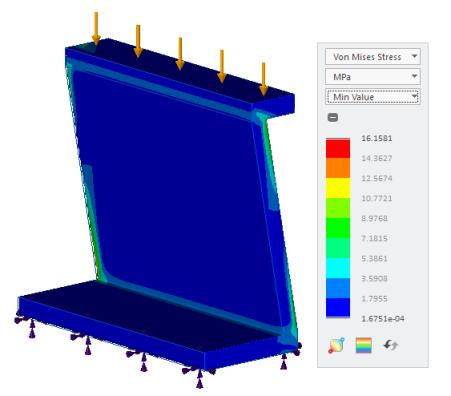
Min Value—Displays the lowest value of a result quantity in the model.
|
 |