Results Legend in Creo Ansys Simulation
Results Legend
Results are displayed with a results legend that is used for the following purposes:
• To vary the range of results displayed.
• To select the units of the results.
• To change the appearance of the results.
The following figure shows the different components of the results legend for an advanced result for displacement magnitude:
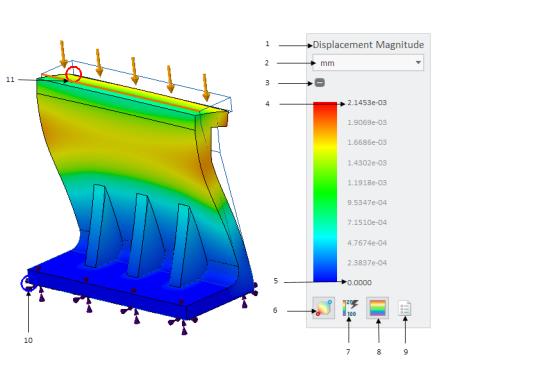
1. Displays the name of the result quantity for advanced results or change the result to view for basic results.
2. Units.
3. Expands or collapses the results legend.
4. Maximum value of result quantity—Double-click to edit when the  button is selected.
button is selected.5. Minimum value of result quantity—Double-click to edit when the button is selected.
button is selected.6.  —Toggles the display of the maximum and minimum values of results on the model in the Graphics Window—For basic results this is the only button available on the legend.
—Toggles the display of the maximum and minimum values of results on the model in the Graphics Window—For basic results this is the only button available on the legend.7. —Toggles between displaying the automatically calculated global maximum and minimum values, and allowing user editable maximum and minimum values of results. When this option is selected you can broaden or narrow the range of displayed results. This button is available for advanced results only.
—Toggles between displaying the automatically calculated global maximum and minimum values, and allowing user editable maximum and minimum values of results. When this option is selected you can broaden or narrow the range of displayed results. This button is available for advanced results only.8.  —Toggles between displaying results as distinct color bands or as diffused colors. The display shows diffused colors by default. This button is available for advanced results only.
—Toggles between displaying results as distinct color bands or as diffused colors. The display shows diffused colors by default. This button is available for advanced results only.9.  —Opens the Advanced Legend Settings dialog box. This button is available for advanced results only.
—Opens the Advanced Legend Settings dialog box. This button is available for advanced results only.10. Minimum value of result shown with a blue circle when is pressed.
is pressed.11. Maximum value of result shown with a red circle when is pressed.
is pressed.The legend settings that you select apply to the active result only, and are saved with the results when you save the model and simulation data.
Advanced Legend Settings
The Advanced Legend Settings dialog box provides the following options:
• Clip to range—Hides data that is out of the specified range. This means that results that are above the maximum, or below the minimum values are not colored in the results. For example, in the following figure the values above the maximum displacement magnitude (more than 1.7 e-3) are not shown when Clip to range is selected.
Clip to range selected 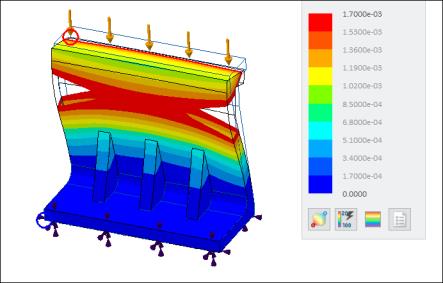 | Clip to range cleared 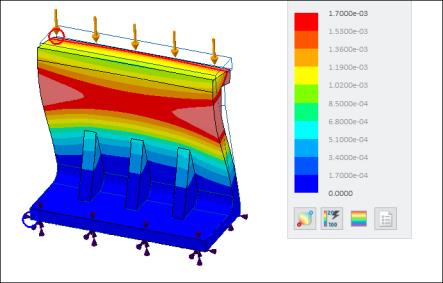 |
• Number of colors—The number of color bands to be shown in the contour plot.
• Color distribution—Select from one of the following options:
◦ Linear—The range of each contour band is constant. The colors are distributed evenly.
This option is useful for contours where the data varies evenly across the variable range.
◦ Logarithmic—The distribution of color bands uses a logarithmic scale.
This option is useful for contours where the data is heavily skewed towards the lower end of the variable range.
The following example shows linear and logarithmic distribution for the same range of results.
Linear Distribution 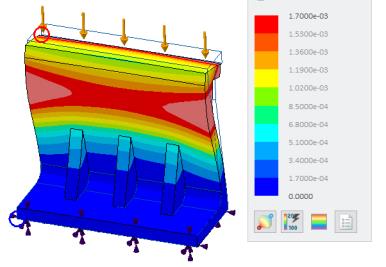 | Logarithmic Distribution 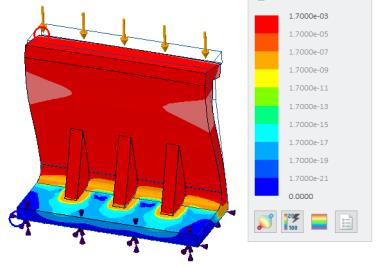 |