To Analyze the Build Direction
1. On the Analysis tab, click  Build Direction. The Build Direction dialog box opens, with the General tab displayed.
Build Direction. The Build Direction dialog box opens, with the General tab displayed.2. To define the regeneration mode for the build direction analysis feature, next to Regenerate, select an option:
◦ Always—Recalculates the analysis and updates the parameters every time the model is changed and regenerated. This could take a long time.
◦ Read Only—Does not update the parameters even if the model is regenerated, but you can run the analysis.
◦ Design Study—Only during the study, the feature regenerates and its parameters are updated, but not during the regular regeneration or the build direction optimization.
3. Click the General tab, and define these parameters:
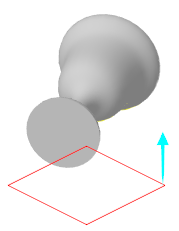
a. Select the Build tray collector, and select a datum plane that represents the build tray. The build direction is normal to this plane.
Two items appear: an arrow that is normal to the plane that represents the build tray, and a dragger that you can rotate to define the model orientation on the tray.

b. To define the critical angle:
a. Next to Critical angle, type an angle. Surfaces from zero to the critical angle must have support to be 3D printed.
The system measures the angle between the build direction, and the normal to the external surface of the model, and identifies surfaces less than the critical angle.
b. Select a color to represent surfaces identified as less than the critical angle.
c. To define the sub-critical angle:
a. Next to Sub-critical angle, type an angle. Surfaces from the critical angle to the sub-critical angle do not require support to be 3D printed, but they could have problems or low surface quality in 3D printing.
The system measures the angle between the build direction, and the normal to the external surface of the model, and identifies surfaces between the critical angle and the sub-critical angle.
b. Select a color to represent surfaces identified as between the critical angle and the sub-critical angle.
d. To define the minimal surface area to consider in the analysis:
a. Next to Minimal area size, type an area value.
b. Select the units for the minimal area.
e. To exclude geometry from the calculation:
a. To define geometry to exclude, perform any of these actions:
▪ To exclude internal surfaces from the calculation, select the Exclude internal volumes check box. If it is not selected, all surfaces are analyzed.
▪ To exclude specific surfaces from the calculation, click the Exclude from calculation collector, and select surfaces to exclude.
b. Select a color to represent all excluded surfaces, both internal, and manually-selected.
4. To define the sampling type, next to Sample, select an option:
◦ Quality, and then use the slider or type a value.
◦ Step, and then use the dial or type a value.
◦ Number, and then use the dial or type a value.
5. To define the build direction orientation, click the Orientation tab, and perform one of the following actions:
◦ To define the build direction orientation manually, under Euler angles, use one of these methods:
▪ Type angles for  ,
,  , and
, and  .
.
, , and .▪ Next to Select direction, click  , and then select one of the following items:
, and then select one of the following items:▪ Planar surface or datum plane—Build direction is normal to the plane
▪ Straight edge or curve, datum axis, axis of a coordinate system—Build direction is parallel to the selected geometry
Click  to reverse the direction. This value is not remembered after the current actions.
to reverse the direction. This value is not remembered after the current actions.▪ Rotate the dragger to set the angle in each direction.
◦ To define the build direction orientation by optimization:
1. Under Optimization, select the goal to optimize:
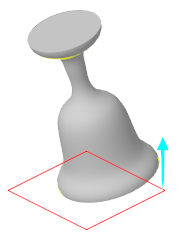
▪ Downskin area—Minimize the area that requires support for 3D printing.
 | 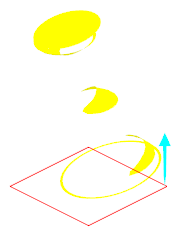 |
▪ Shadow area—Minimize the area that the model projects onto the printing tray (x-y plane).
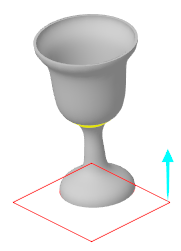 | 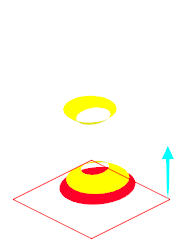 |
▪ Height—Minimize the height of the model.
 |  |
6. To compute the optimal orientation for the model:
a. On the Orientation tab, click Compute Optimal Orientation. The Advanced Optimization dialog box opens.
b. To set the optimization preferences, click > . The Preferences dialog box opens. Set the preferences on the following tabs:
▪ Graph—To graph the parameter values during computation, select the check boxes for any of the following parameters:
▪ Goal
▪ Constraint
▪ Variables
▪ Run
▪ To specify when to end the computation based on the percentage difference between the successive result values of the optimization cycles, type a percentage next to Convergence %.
▪ To specify the maximum number of computation cycles, type a number next to Max. iterations.
▪ Method
▪ Select the calculation algorithm:
▪ GDP—Generalized disjunctive programming, a standard algorithm that optimizes the model using the current model conditions as the starting point.
▪ MDS—Multi-objective design studies, an algorithm that optimizes the model using multiple starting points.
▪ To define the maximum number of starting points, next to Max. iterations, type a number.
MDS can take a long time, and requires several iterations. This method has a higher chance of finding the overall optimum design within the design parameters and dimensions.
c. If needed, add constraints to other parameters in the model:
a. Under Design Constraints, click Add. The Design Constraint dialog box opens.
b. Under Parameter, select the parameter to constrain.
c. To define the parameter value:
a. Select an operations symbol.
b. Next to Value, select an option:.
▪ Click Current to use the current parameter value.
▪ Click Set to define a new value, and then type the value.
The build direction analysis minimizes the critical area for the goal. For an example of adding a constraint to also minimize the sub-critical area, see Example: Adding a Sub-critical Parameter Constraint to a Build Direction Analysis.
d. Click OK.
d. In the Advanced Optimization dialog box, click Compute. A convergence graph opens while the optimization runs.
e. When the optimization is finished, close the convergence graph.
f. Close the Advanced Optimization dialog box.
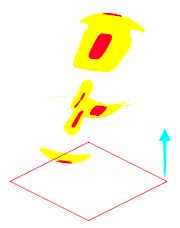
7. To explore the build direction analysis results, in the Build Direction dialog box, perform any of the following actions:
◦ Toggle any of the following commands to show or hide items:
▪  —Surfaces with an angle from zero through the critical angle
—Surfaces with an angle from zero through the critical angle
▪  —Surfaces with an angle from the critical angle through the sub-critical angle
—Surfaces with an angle from the critical angle through the sub-critical angle▪  —Surfaces excluded from the calculation
—Surfaces excluded from the calculation
▪  —Model geometry
—Model geometry◦ To open the results dialog box, click  . The Distribution Graph dialog box opens containing the following information:
. The Distribution Graph dialog box opens containing the following information:▪ Histogram showing the number of critical patches and patch area. The y-axis shows the number of patches. The x-axis shows the patch area.
You can select the bars in the histogram, and the corresponding patches are highlighted in the graphics window.
▪ To edit the ranges of the bars in the histogram:
1. Click  . The Edit Ranges dialog box opens.
. The Edit Ranges dialog box opens.2. For each bar, type a minimum range and maximum range.
3. To add a bar, click 
4. Click OK.
The range definition is saved inside the feature.
▪ Overall downskin area
▪ Shadow area
▪ Height
▪ Number of critical patches
When you are finished exploring the results, close the Distribution Graph dialog box.
8. To save the new view orientation, in the Build Direction dialog box, click  Save New View Orientation. The new view appears in the
  Saved Orientations menu in the graphics toolbar.
Save New View Orientation. The new view appears in the Saved Orientations menu in the graphics toolbar.9. In the Build Direction dialog box, click OK. In the Model Tree, a Build Direction feature is created, represented by  . A coordinate system whose z-axis indicates the build direction appears in the graphics window.
. A coordinate system whose z-axis indicates the build direction appears in the graphics window.