Summary of Tolerance Stackups
The Summary of 1D Tolerance Stackups table lists all the stackups.
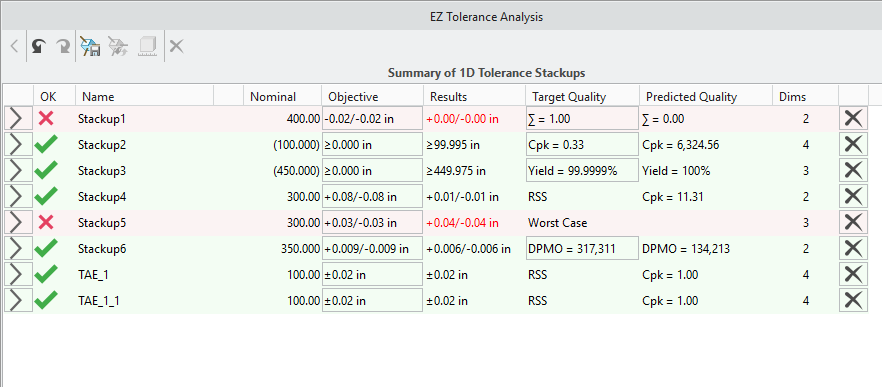
A description of the table columns follows:
•  —Details of a stackup. Click to open the Stackup Details table.
—Details of a stackup. Click to open the Stackup Details table.• OK—Indicates whether a stackup result meets the defined objectives.
◦  —Objectives are verified.
—Objectives are verified.◦  —Objectives are not achieved.
—Objectives are not achieved.• Name—Name of the stackup, in the form Stackup<number> when created. The <number> is appended sequentially for each new stackup that you define. You can double-click a stackup and type a unique name.
• Nominal—Nominal distance between the selected items for which you want to define the stackup analysis. When you use symmetric ± or unique +/- values to define the upper and lower limits of the objective relative to the nominal, the nominal value appears without parentheses. In this case, the nominal value is part of the objective definition. For the other tolerance types described in the next bullet point, the nominal value is included for reference and therefore appears in parentheses.
• Objective—Type and value of a tolerance objective. Click the value to open the Edit Tolerance dialog box. You can select a different tolerance type for defining the upper and lower objectives of the stackup. Because most tolerances stackups are defined to ensure a clearance for fit, the default objective value for all new stackups is ≥ 0.
The following types are supported:
◦ ± (symmetric)—Bilateral value applied relative to the nominal value.
◦ +/- (plus-minus)—Non-symmetric values applied relative to the nominal value. The +/+ and -/- definitions are supported.
◦ Limits—Definition of absolute upper and lower limits for the objective independent of the nominal value.
◦ ≤ (upper limit)—Definition of a single upper limit.
◦ ≥ (lower limit)—Definition of a single lower limit.
• In the specified objective values, the number of digits determine the precision to be used. However, if you specify a value without a decimal the precision is not changed. • The sign and value of the number that you specify are evaluated to determine if it must be placed in the upper or lower segment of +/- and Limits objective types. If you do not specify a sign, the existing sign designated for the field is applicable. |
• Results—Results of the stackup analysis based on the defined target quality level. The results are presented in the same tolerance type used for the objective definition, for example, ±, +/-, or Limits.
• Target Quality—Type of analysis to perform. Select the stackup and then select a target quality from the Analysis type list.
◦ Worst Case—All dimensions are assumed simultaneously to be at the extreme permissible limit, which is needed to minimize or maximize the stackup distance being analyzed.
◦ RSS—The Root Sum of the Squares (RSS) is a statistical method for calculating the combination of dimensions based on the assumption that not all dimensions involved in the stackup are at their limits simultaneously. The key difference between this approach and the more general statistical approach, is that the RSS method assumes that each of the contributing dimensions has the same quality level as the calculated result. The assembly shifts resulting from clearances between parts and from material modifiers that are applied to the datums features in a Datum Reference Frame are deemed as worst-case effects, such as the assembly shifts to one extreme or the other, before calculating the RSS combination of the tolerances involved.
◦ Statistical—Based on the same principals used for the RSS analysis, the advantage of Statistical approach is that you can define the target quality level for the stackup regardless of assumptions made for the part dimensions. It also regards the clearances associated with assembly and datum shifts as statistical contributors having a uniform distribution. You can use the following metrics to define the target quality level for statistical analyses:
▪ Cpk
▪ Σ (Sigma)—Different from lower case σ, which represents the standard deviation of a normal distribution.
▪ % Yield
▪ DPMO (Defects per Million Opportunities)
You can define the default target quality and the default values for the various quality metrics in the Options dialog box. Click > to open the Options dialog box. |
• Predicted Quality—Calculated quality of the stackup distribution compared with the defined objective, when target quality is set to use one of the statistical methods. For example, for RSS, the label shows Cpk. For the general statistical analyses, the label shows the same metric type as defined for the target quality.
• #Dims—Number of dimensions contributing to a stackup. This helps you determine whether to use Worst Case or one of the statistical options for the target quality.
• Delete—Delete the stackup definition from the table. Click  to restore the stackup definition.
to restore the stackup definition.