Results and Contributions
On the EZ Tolerance tab, results and contributions appear in the Summary and Details tables. By default, the Results subtab is selected.
Summary Results
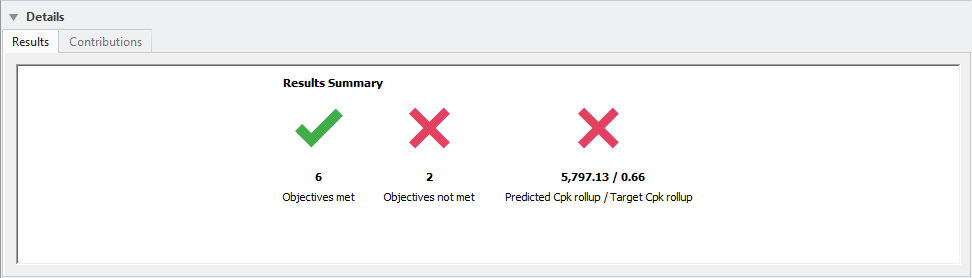
When a stackup in the summary table is not selected, the summary of the stackups that meet and the stackups that do not meet the defined objectives appears in the Results tab. A quality roll-up for all statistically based stackups against the preferred quality metric set in the Options dialog box also appears. Click > to open this dialog box.
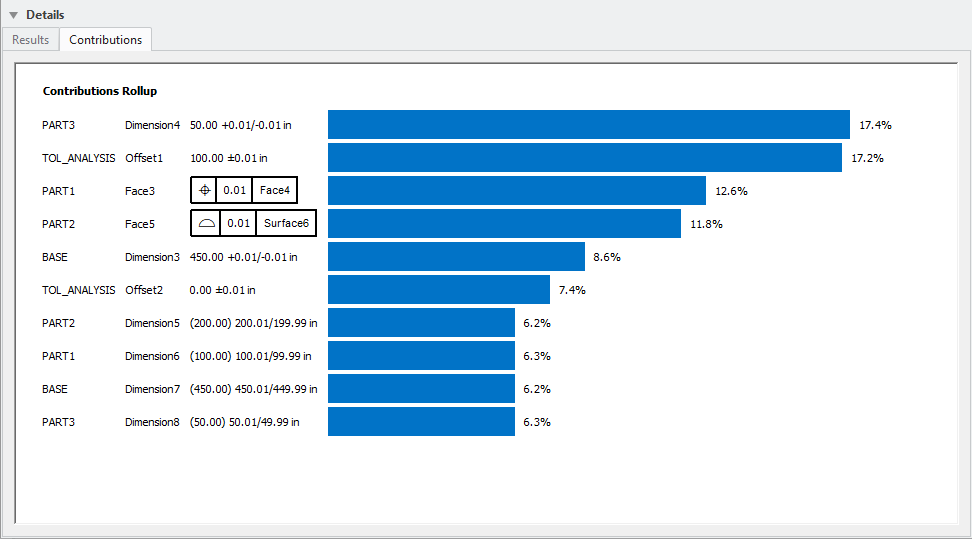
The Contributions tab for this section, when none of the stackups in the Summary Table are selected, shows a contributions roll-up of the dimensions across all defined stackups.
Detailed Results for a Stackup
In the Summary table, click a stackup row to display the Results Graph and the Contributions for the selected stackup.