To Compare Two Graphs
Matching two graphs involves two basic steps:
1. Create a Relation Analysis Feature that compares two graphs. Use the Analysis feature to compute the difference between the graphs.
2. Run an optimization study to minimize the difference.
To compare two graphs, add a relation using the following syntax: relation_name = comparegraphs("name_1", "name_2", "type", left_bound_1, right_bound_1, left_bound_2, right_bound_2) where:
• relation_name—is the name for the relation.
• name_1—is the name for the first graph or analysis feature.
• name_2—is the name for the second graph or analysis feature.
• left_bound_1 and right_bound_1—are the left and right boundaries of the first graph.
• left_bound_2 and right_bound_2—are the left and right boundaries of the second graph.
• type—is the method for computing the difference between the graphs. Choose from the following types: lone (default), ltwo, linf, or area. The table explains the different types of measurement.
|
Measurement Type
|
Based on the Formula
|
What it Measures
|
|---|---|---|
|
lone
|
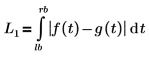 |
Measures the area between graphs of f(t) and g(t).
Where,
• lb = left_bound
• rb = right_bound
• lb<t<rb
|
|
ltwo
|
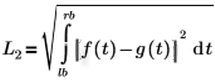 |
When |f(t) - g(t)| is a measure of the deviation, larger values of the deviation have more weight on the L2 norm.
|
|
linf
|
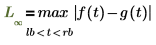 |
Measures the maximum deviation between two functions.
|
|
area
|
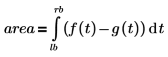 |
Measures the signed area between graphs of f(t) and g(t).
|
When specifying arguments for the comparegraphs function, you have the following options:
• Specify only two arguments—Specify the names for the graphs only. By default, the system uses the lone measurement type and the entire lengths of the graphs.
• Specify only three arguments—Specify the names for the two graphs and the measurement type. By default, the system uses the entire lengths of the graphs.
• Specify all 7 arguments.
|
|
You can specify the name for the second graph (name_2) as “zero". Then the system will compute the function with respect to the horizontal base y=0.
|