To Perform a Draft Check on a Part
1. Click >  Draft. The Draft Analysis dialog box opens. Quick is the default analysis type.
Draft. The Draft Analysis dialog box opens. Quick is the default analysis type.2. Click in the Surface collector and select one or more surfaces, quilts, solid geometry, or facets on which you want to perform an analysis. The selected entities are displayed in the Surface collector.
3. Click in the Direction collector and select a reference plane, coordinate system, curve, edge, or axis to specify the pull direction, that is, the direction used to measure the draft angle. A color plot for the selected surface is displayed in the graphics window. Also the Color Scale dialog box opens. You can flip the reference to reverse the direction indicated by the arrow on the model.
To clear the contents of the collector, right-click in the collector and click Remove on the shortcut menu. You can then continue to select a required surface, model, or reference in the collector. |
4. Click OK to complete the analysis or Cancel to cancel the analysis. Alternatively, click Repeat to start a new analysis.
5. Optionally, to save the analysis, perform the following steps:
a. Select Saved from the list at the bottom of the Draft dialog box to save the analysis with the model, and to dynamically update and display the analysis while modeling.
b. If required, rename the analysis in the box adjacent to the list.
6. Click  in the Color Scale dialog box to view the color scale options.
in the Color Scale dialog box to view the color scale options.7. Click  and move the pointer over the colored model to display the draft value of a colored surface in a tooltip at the pointer location. As you move the pointer over the colored model an indicator moves along the color scale indicating corresponding draft value and color at the pointer location.
and move the pointer over the colored model to display the draft value of a colored surface in a tooltip at the pointer location. As you move the pointer over the colored model an indicator moves along the color scale indicating corresponding draft value and color at the pointer location.8. To display a specific color range on the model from the color scale, you can select the following options from the Model Display list:
◦ Positive Draft, the color of the positive draft range from the color scale is applied to the areas with the positive draft angle. All other areas remain transparent.
◦ Positive Values — It is the draft value range.
◦ Verticals — Verticals are surfaces with zero angle.
◦ Negative Draft — The color of the negative draft range from the color scale is applied to the areas with the negative draft angle. All other areas remain transparent.
◦ Negative Values — The arrow points to the area between the negative values.
◦ Verticals/Positive — Displays the positive verticals, if it exists.
◦ Verticals/Negative — Displays the negative verticals, if it exists.
9. If required, click  to restore the default values of the color scheme.
to restore the default values of the color scheme.10. Click  to switch between the continuous and non-continuous color display. For non-continuous color display you can specify the number of colors for the color scale in the Number box.
to switch between the continuous and non-continuous color display. For non-continuous color display you can specify the number of colors for the color scale in the Number box.The logarithmic type of plotting style is not available for Draft analysis. |
Note the following points about the color plot:
◦ The color plot is displayed in the graphics window using the minimum and maximum display angles which are equal to minus and plus the angle specified in the Draft box in the Draft dialog box. Modify the angle values in the color plot or change the color scale settings to specify different values for the display angles.
◦ If you modify the angle specified in the Draft box, the minimum and maximum display angle values are updated automatically.
◦ Geometry areas outside the maximum display angle are displayed in the color shown in the swatch for the maximum color gradation.
◦ Geometry areas outside the minimum display angle are displayed in the color shown in the swatch for the minimum color gradation.
◦ Geometry areas having zero draft angle value are included in the verticals range and are displayed in color shown in the swatch for middle color. White is the default middle color.
◦ You can customize the minimum, maximum, and middle color using the Color Editor that opens when you click on the color swatches.
11. Optionally, to customize your color plot, click one of the following in the Color Scale dialog box:
 —Displays a rainbow type of color plot for the selected surface or surfaces.
 —Displays a three-color type of color plot for the selected surface or surfaces.
12. Click  in the Color Scale dialog box to save the color scheme settings to a .txt file. Clicking opens the Save Color Scheme dialog box with color_scheme as the default filename in the File Name box. If required, specify a new name and click OK. By default the file is saved to the working directory.
in the Color Scale dialog box to save the color scheme settings to a .txt file. Clicking opens the Save Color Scheme dialog box with color_scheme as the default filename in the File Name box. If required, specify a new name and click OK. By default the file is saved to the working directory.To load a color scheme click  and browse to the.txt file that contains the color scheme settings. and browse to the.txt file that contains the color scheme settings. |
13. Optionally, to customize or edit your analysis, perform the following steps:
a. Specify a value for the draft angle in the Draft box. You can change the draft angle by typing the value directly in the graphics window.
b. Select the Quality, Number, or Step as the sampling type in the Sample box. Quality is selected by default. Adjust the sample values using the slider.
c. Update is selected by default. You can see the effects of your selections or changes on the analysis plot as you make them. Clear the Update check box to select or adjust multiple analysis options, and click Preview to view the result of the analysis.
The Bracketed area percentage and Estimated maximum error percentage is displayed in the Draft Analysis dialog box.
For example, when you create a cube with dimension 100 and default unit system, draft angle 3, and a draft value of 4, following analysis is displayed in the graphics window:
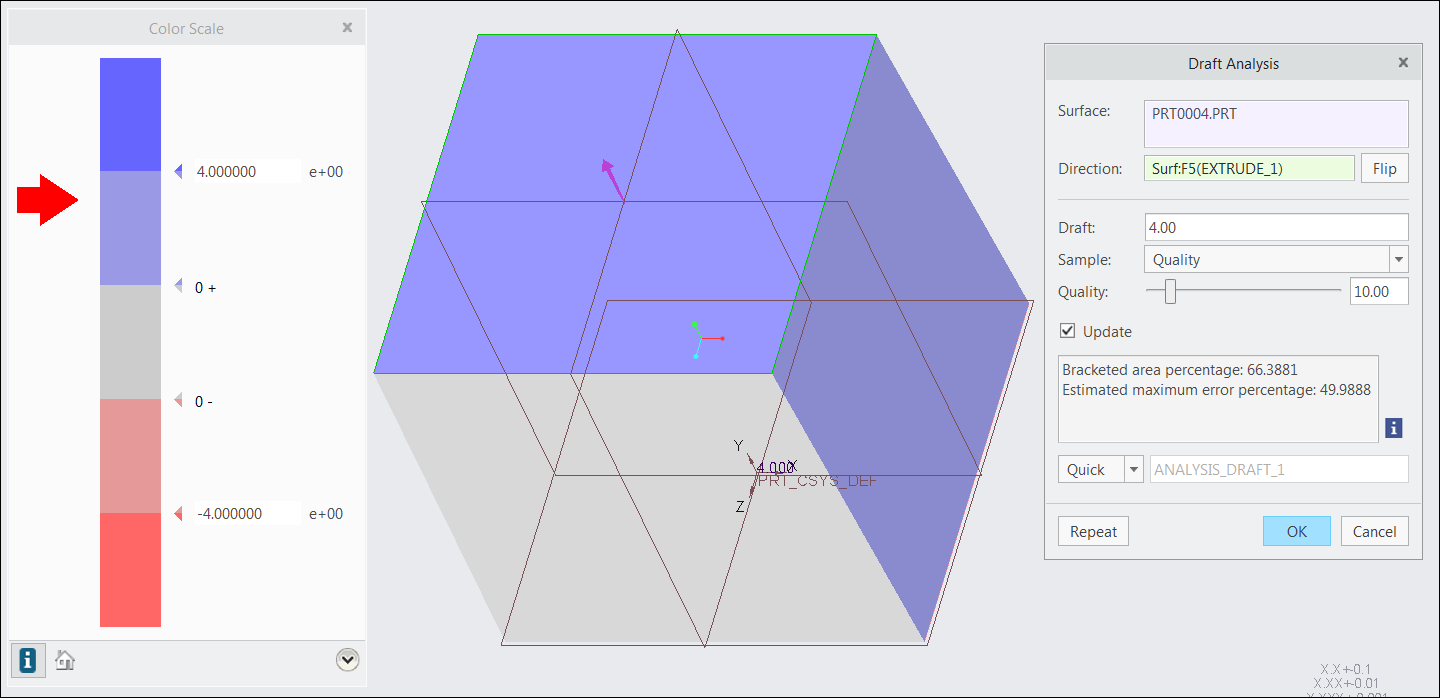
Bracketed area percentage — Is the total area between negative to positive of the draft angle. In this case, the bracketed area percentage is within the angle - 4 to + 4.
The total area of the cube, which has 6 surfaces is 61061.9.
The total area within the range of - 4 to + 4 ,that is, the positive value is 40537.8.
The percentage of the bracketed area is calculated as follows: Bracketed Area Percentage = Positive value/Total area of cube * 100
In this example, it is 40537.8 / 61061.9 * 100 = 66.3881.
Estimated maximum error percentage — Is the total area within the range - 0 and + 0.
The total area of the cube, which has the 6 surfaces is 61061.9
The total area within the range of - 0 to + 0 is 30524.11.
The estimated maximum error percentage is calculated as follows: Estimated maximum error percentage = Verticals / Total area * 100.
In this example, it is 30524.11 / 61061.9 * 100 = 49.9888.