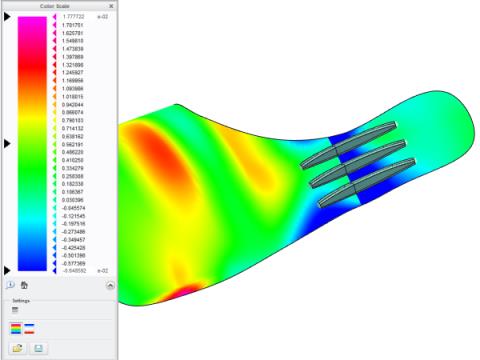
Example: Shaded Curvature of a Surface
Surface analysis assigns color values in ranges to show curvature. Values toward the red end of the spectrum indicate maximum curvature or slope. Minimum curvature values are shown toward the blue end of the spectrum.
A Shaded curvature is the product of the smallest and largest normal curvatures for every point on a surface.