EZ Tolerance Analysis Enhancement: New Option to Show Worst Case Results on RSS and Statistical Graphs
Creo Parametric 12.4.0.0
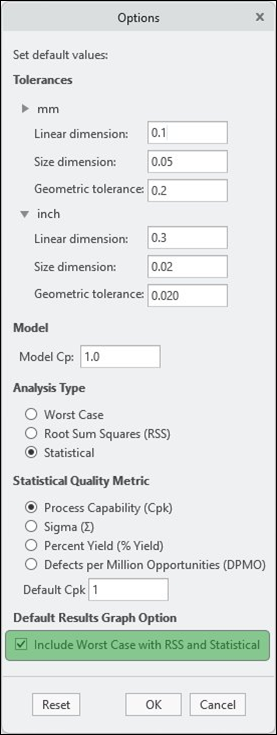
User Interface Location: A new checkbox has been added to the dropdown, allowing the user to select the desired analysis type for the stackup.
In addition, the application options menu now includes a new checkbox, allowing the user to specify this option for new stackups.
Description
Users often prefer to see the worst-case analysis for stackups, even if the stackup was analyzed using a different statistical metric.
The new stackup option allows users to display the worst-case analysis graph alongside the RSS or any other selected statistical analysis type.

Benefits
With this enhancement, users can easily view the worst-case analysis alongside other statistical metrics selected for the stackup analysis.
Additional Information
Tips: | None. |
Limitations: | No known limitations. |
Does this replace existing functionality? | No. |
Configuration option associated with this functionality: | None. |