About Datum Graphs
The Datum Graph feature creates a 2D sketch of an x-y function that is saved as a feature in the model. The graph appears as a feature in the Model Tree, and can be used in downstream operations.
A datum graph is created similarly to creating a sketch, but there is not any visible curve created in the graphics window when you exit the feature. A datum graph must contain a coordinate system, and it is good practice to include centerlines as x- and y-axes.
Once you create a datum graph, the system can use the sketch as an x-y function.
Creating a datum graph
1. Click > >  Graph. A mini toolbar opens.
Graph. A mini toolbar opens.2. Enter a descriptive name for the graph, and then click  . The Sketch tab opens.
. The Sketch tab opens.3. To place the coordinate system, in the Sketching group, click  Coordinate System, and click the graphics window.
Coordinate System, and click the graphics window.4. As a best practice, to sketch the axes of the graph, in the Sketching group, click  Centerline, and sketch a horizontal centerline for the x-axis and a vertical centerline for the y-axis.
Centerline, and sketch a horizontal centerline for the x-axis and a vertical centerline for the y-axis.5. Sketch the graph.
6. Click OK.
OK.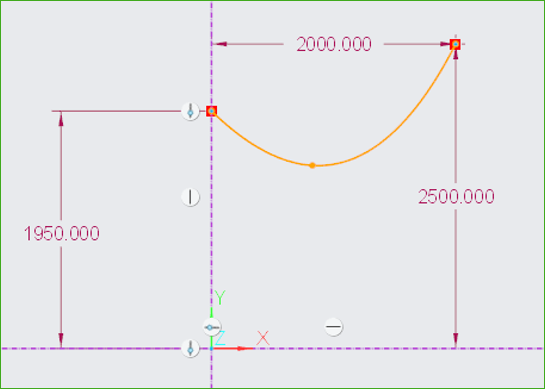
Using datum graphs
Datum graphs can be used in different ways. Here are a few examples:
• Drawings
Click > > Graph to insert datum graphs into a drawing.
Graph to insert datum graphs into a drawing.• Graphs evaluation function
With the graph evaluation function, you can use graph features to drive dimensions through relations in a section, part, or assembly. This is the format of the function:
evalgraph("graph_name", x)
◦ graph_name—Name of the graph.
◦ x—Value along the x-axis of the graph for which the y-value is returned.
See the links below.
• Analyses
You can compare two graphs to determine the difference in the distribution of one parameter along the other parameter.
See the links below.