Knowing the quality of surfaces in your model can be important, particularly in plastic housing design. Creo Elements/Direct Modeling offers a tool that analyzes the surface curvature of selected faces or parts. Color-coding on the surfaces points to potential trouble areas, such as surface wiggling, that you can then correct if necessary.
The surface analysis tool can also be used to check the maximum and minimum radius values of a face. This can be used, for example, to determine whether a Shell operation will fail or succeed, based on the quality of a face.
As soon as you select a single face, radius feedback appears on the face and moves with the cursor. The radius information is for the point where the cursor is located. The main curvature circles (the circles where the maximum and minimum radius values are adopted) are displayed in the viewport. The corresponding minimum and maximum radius information is displayed in the prompt text line.
Use Zebra stripes to determine the acceptability of surfaces and the transitions between faces.
For Surface Analysis,
1. Activate the Surfacing module.
a. Click File > Modules. The Modules dialog box opens.
b. On the Modules pane, click Surfacing under Licensed.
2. Click Analysis and then, in the Analyse group, click Surface. The Sf Analysis dialog box opens.
The following options are available to help you control the surface analysis:
• Type: The type of analysis: Gaussian curvature, Mean curvature, or Zebra stripes.
• Faces or Parts: You can specify one or a selection of either faces or parts.
• Facet Refinement: A temporary refinement of the facet model of the selected parts or faces. A better model resolution can lead to a better analysis result. (You can see the facet model by turning on Wire in the Show menu.)
• Displ Range : Creo Elements/Direct Modeling automatically calculates the most informative maximum curvature to display in the analysis. However, you can also enter a value manually if you are interested in a particular curvature value range.
• Color Coding: The color distribution used in the graphical display of the analysis. The first color depicts the most positive curvature values, the middle color represents values close to 0, and the last color indicates negative curvature values.
• Max and Min Curvature: The surface parameters of the selected faces or parts; these fields display the maximum and minimum curvature values.
A Facet refinement setting is effective only during the current analysis. A permanent refinement is done by changing the facet accuracy of a part or face, which can enhance its graphical resolution.
For curvature analysis,
1. Activate the Surfacing module.
a. Click File > Modules. The Modules dialog box opens.
b. On the Modules pane, click Surfacing under Licensed.
2. Click Analysis and then, in the Analyse group, click Surface. The Sf Analysis dialog box opens.
3. Specify the type of curvature to use in the analysis: Gaussian curvature, mean curvature, or Zebra stripes.
4. Specify the Faces or Parts over which the analysis is to be performed. You can select a single face or part or use the Select tool and make a list. A preview of the selected faces is displayed.
5. To analyze a particular range of curvature values (Gauss or mean), enter a maximum curvature value in the Displ Range field. Otherwise leave this field empty (an appropriate value will be calculated automatically).
6. Select the desired color distribution from the Color Coding cascade list.
7. The selected faces are displayed using the analysis colors, and the Surface quality contour map appears in the viewport.
8. To modify the facet model of the selected faces, click Less or More in the Facet refinement list. Note that this refinement is temporary; the normal facet model is resumed when the analysis is completed.
9. Continue to adjust analysis parameters, or click to finish the surface analysis.
The appearance of the Surface quality contour map in the viewport is controlled by a number of parameters. You can change these settings in the Contour Map menu accessed from the Viewport menu.
For face to face transition analysis,
1. Activate the Surfacing module.
a. Click File > Modules. The Modules dialog box opens.
b. On the Modules pane, click Surfacing under Licensed.
2. Click Analysis and then, in the Analyse group, click Surface. The Sf Analysis dialog box opens.
3. Specify the type of curvature to use in the analysis: Zebra stripes.
4. Specify the Faces or Parts over which the analysis is to be performed. Neighbor faces are automatically selected for analysis. A preview of the selected faces is displayed.
5. Select the type of Display Parameter: Spherical or Cubical. The display parameter determines the kind of stripes that are reflected in the model.
6. Change the thickness of the zebra stripes by moving the tab in Stripe Number.
7. Change the ratio of stripe colors by moving the tab in Color Ratio.
8. Continue to adjust analysis parameters, or click to finish the surface analysis.
 Surface. The Sf Analysis dialog box opens.
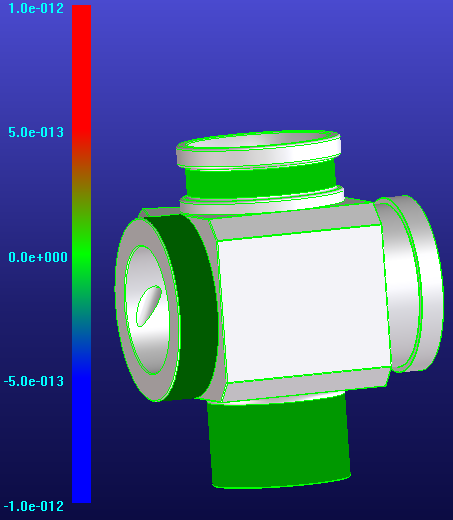
 to finish the surface analysis.