Tracking Releases: Progress Reports
To check the status of your current releases, use the Release category in your project. This screen displays a real-time progress report for all your releases.

All current and future releases are shown by the name. To see the list of items associated with a particular release, click the  icon next to the name of the release. The items are listed in descending priority and are color-coded that represents the current status of the items. The green indicates the resolved items while the white indicates the outstanding items.
All current, future, and past releases are also listed. By default, the items that belong to the releases that are marked as completed are not displayed. To view those items, select the Show Released checkbox on the right side of the screen.
Quick Access Links
Hovering over a Release displays the links to the following views of that release:
• Planner.
• Kanban Board.
• Traceability Report.
• Coverage Browser.

Gantt Chart
You can view a release and its sprints in a Gantt chart. For more information, see Release Gantt Chart.

Burn Down Chart
The Release Dashboard displays the burn down chart for the release above the filters. To view the burn down chart, click the  icon. The Burn Down Chart configuration window opens. The Data Source list includes the following configuration options:
• Number of items
• Story Points
• Both
You can also select the following options to configure the burn down chart:
• Show Burn Down
• Show Velocity
• Show New
• Show Ideal Line
• Apply Project Calendar

Every user can configure the chart view as per their preference.
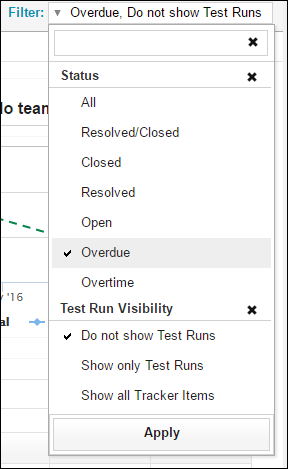
You may see overdue items in the progress information.

Overdue items are marked in the table row. To view the status of the items, click the release name to open the Release Details screen, and then select the appropriate status in the Filter list.