用户指南
>
关于用户指南
>
Codebeamer:常见概念
>
Wiki
>
Wiki 标记和插件
>
图表
> 散点图
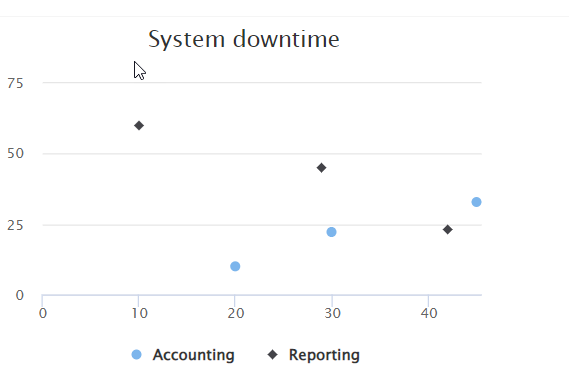
散点图
[{ ScatterPlotChart title='System downtime'
Accounting
* 10, 20
* 22, 30
* 33, 45
Reporting
* 60, 10
* 23, 42
* 45, 29
}]
这对您有帮助吗?
此站点在 JavaScript 启用时工作最佳