사용자 안내서
>
사용자 안내서 정보
>
Codebeamer: 공통 개념
>
Wiki
>
Wiki 마크업 및 플러그인
>
차트
> 선형 차트
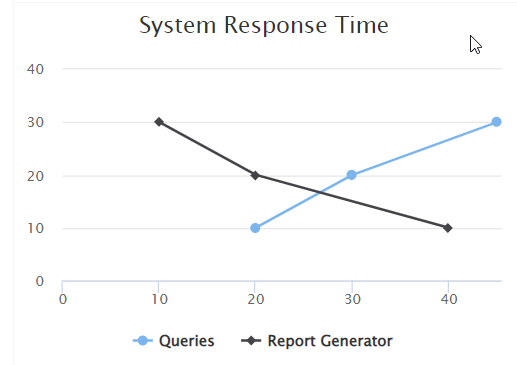
선형 차트
[{ XYLineChart title='System Response Time'
Queries
* 10, 20
* 20, 30
* 30, 45
Report Generator
* 10, 40
* 20, 20
* 30, 10
}]
도움이 되셨나요?
이 사이트는 JavaScript를 사용할 때 가장 잘 작동합니다.