Risk Matrix Diagram
What is Risk Matrix Diagram?
The Risk Matrix Diagram displays the amount of requirement items based on the likelihood and severity values of the associated risk(s). The functionality creates a matrix, with the Y axis representing Likelihood values and the X axis representing Severity values.
Configuration
The matrix must be configured using the Risk tracker's specific custom fields and/or the Risk Management tab of the Tracker customization page. These parameters have default settings in the newly generated risk trackers.
• Likelihood intervals: Custom choice field for configuring Likelihood intervals.
• Severity intervals: Custom choice field for configuring Severity intervals.
You can set these intervals and also the background colors of the matrix on the Risk Management tab of the Tracker customization page.

This plugin will only function effectively if the risk tracker being used has the correct field setup |
Usage
The Risk Matrix Diagram is accessible through Risk type trackers as well as Requirement or User Story type trackers that are linked to any Risk type tracker. The Risk Matrix Diagram can be accessed from the view context menu on the top right of the tracker header or the  more menu on the action bar below the header.
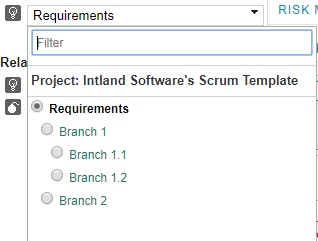
On the left side you can see the current tracker, and the other related requirement and risk trackers of the projects. If the current tracker is a Requirement or a User Story tracker and there are more related risk type tracker, a selector appears and you can filter the result by any risk tracker.

From Codebeamer 9.0.0 you can change the initial tracker and also you can select tracker branches if available.
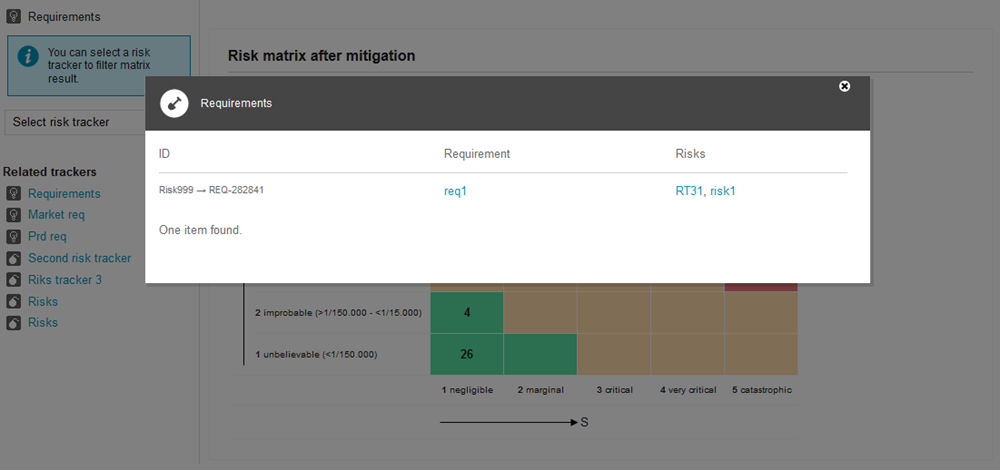
There are two tabs on the right side: Risks and Requirements with Risk. Each tab comprises three matrices: the initial risk matrix, the risk matrix after mitigation, and the combined risk matrix (if the after mitigation values are not specified, the initial values are utilized). An overlay with the details of the relevant requirement items or risk items shows when you click the number of the cells.

Export to Office
It is able to Export all the matrixes displaying in this page into MS Word or MS Excel. Click either of the  as per your requirement and the matrices will be exported accordingly.
as per your requirement and the matrices will be exported accordingly.