tagdebug
Description
tagdebug invokes an interactive GUI that shows the flow of tags as they are processed during the formatting of code. It is intended to be used by template developers who are having problems with reconciling how they view their document and how PTC ALD is processing it. It extends PTC ALD current tagtrace tag debugging facility by providing a visual and interactive view of the formatting process.
Syntax
tagdebug mode:L? pos:t?
tagdebug
|
[no parameter]
|
Invoke the Format Debugger dialog box
|
|
mode
|
|
-w
|
+ expression: create a watch variable for the current document using the given expression
|
|
-bl
|
+ tag name + pos: create a location breakpoint for the current document at the location specified by the tag name and the pos parameter
|
|
-bt
|
+ tag name: create an enter tag breakpoint for the current document using the given tag name
|
|
-bx
|
+ expression: create an expression breakpoint for the current document using the given expression
|
|
-w0
|
Delete all watch variables from the current document
|
|
-b0
|
Delete all breakpoints from the current document
|
|
|
pos
|
The stream position of the location breakpoint specified by the mode option -bl
|
Additional Information
The tag debugging facility
PTC ALD templates can be tricky to debug, depending on how the initial code has been constructed. tagdebug will allow developers to trace through their formatting tags and text streams to see the order in whichPTC ALD processes them. It allows them to step into, over and out of tags. It will show the position in the document that execution has reached; the stack of streams at that point; the values of counters and strings; and will allow for arbitrary expressions to be evaluated. Breakpoints can be set to stop the debugger at a particular position. This can be done in a variety of ways: entering a <?breakpoint> PI in the document source, setting a breakpoint in the source window from a right click menu, or setting an expression breakpoint which stops when the given expression changes value. It provides for the evaluation of arbitrary user entered expressions which, as with the other data shown, is updated after every step.
Terms
Tag
Any entity in the data, including text streams, styles and references.
Token
The occurrence of a tag reference in a tag. See the code block below for an example of a special heading:
<!— a comment –> <heading>•
<?tul=1> Some text...
This code consists of a comment token, a style token (heading), a reference token (bullet), and then a PI token (underline). Tagdebug steps between tokens as they are consumed by the formatting engine.
|
|
The trailing static text Some text... is not considered to be a token; it is merely raw text to be formatted.
|
Stepping
The process of moving from one text token to another.
Step into
View the contents of a tag. Some tokens such as <heading> refer to other tags. When PTC ALD formats this token, it reads the contents of the tag called heading. Tagdebug allows you to ’step into’ this tag when it encounters the token and thus see the contents of heading tag. The heading tag may contain further tokens that refer to other tags and so tagdebug can delve into the structure of the document.
Call stack
The stack of tags which define the current token’s position in the format.
Breakpoint
A trigger to stop the format process. Tagdebug supports a number of different breakpoint triggers:
◦ Location breakpoints trigger if a token is found at a certain position in a particular tag.
◦ Expression breakpoints trigger when the result of an expression changes value.
◦ Tag name breakpoints trigger when entering a particular tag.
Dialog Boxes and Windows
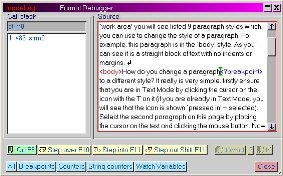
The main tagdebug window
This consists of the tag source window, the current call stack listbox, and a set of buttons along the bottom. There is also a text entry (in the top left) which shows the name of the currently displayed tag. Editing this field to be another tag name will show the source of that tag. Clicking on the entries in the callstack listbox will change the source window to show the selected tag's source and highlight the relevant tag in the callstack. Note that you cannot edit the text in the source window (doing so during a format would not make sense). This shows the main window as it initially appears.
| The buttons marked Go, Step over, Step into, and Step out are initially greyed out, and the buttons tformat and trf are not. Once either a tformat or trf have been activated then this is reversed; the step buttons become active and the formatting buttons are greyed out. |
The tformat and trf buttons determine which kind of format will be debugged; either a full document reformat (tformat) or a page format (trf). Note that if the tagdebug window is open, and we are not yet debugging, then if a tformat or trf operation is run (e.g. from the escape bar) then these formats are not debugged. Only formats started by pressing one of the tformat or trf buttons will start the debugging process.
The blue buttons along the bottom of the window open the respectively named sub windows (described below). Note the first button in the row, marked All, opens all the subwindows in one go.
The close button closes all the tagdebug windows. If in the middle of a format, this is allowed to run to completion. The standard ShiftShift escape mechanism can be used to halt this format.
The graphic above shows the current position of the format, marked by a green marker cursor. Tagdebug sees tokens before they have been processed, so any side effects are only seen on the next step.
Clicking on the a stream tag in the callstack shows the source in the stream and the position reached in the format with a green marker cursor and the reference position with a green marker. The reference position is the position from which we entered the tag i.e. from where we came.
There is a right click menu available in the source window. It provides access to the following actions:
• Breakpoint: set a breakpoint at the current cursor location. The breakpoint is added to the Breakpoints window’s listbox.
| The current semantics require you to left click before the opening character of the tag at which you wish to stop, then right click and select Breakpoint. The left click is required to set the cursor position (simply right clicking does not change the cursor location); although as editing is disabled, currently no cursor is shown. |
• Run to cursor: set a temporary breakpoint at the cursor location (note remark above) then run until the next breakpoint. Once a breakpoint is hit (which may or may not be the place to which you wanted to 'run to') the temporary breakpoint is deleted.
| The macro commands shown on the right click menu are useless as interactive commands and should be considered private. In fact tagdebug uses the syntax tagdebug +? as a form of message passing which, n a number of places within the code, have to be handled without going through the normal macro loop because of tagdebug’s 'living on the format stack' existence. |
The breakpoint window
This consists of a listbox showing all the current breakpoints, a text entry widget with which to enter new expression breakpoints and a combox box from which to select the type of breakpoint you are setting. The Add button adds the breakpoint you have just typed and the Delete button removes a selected entry from the listbox.
The entries in the Type combo box specify how tagdebug interprets whatever has been typed in the Data entry:
• PTC ALD expression: the data field is interpreted to be an PTC ALD expression and is evaluated after every token during the format. If the result of that expression changes, the breakpoint triggers and tagdebug halts.
| Tagdebug shows the token that is about to be evaluated so the breakpoint will stop the debugger at the token after the one that caused the expression to change value. |
See the section on watch variables for examples of the syntaxes accepted for the PTC ALD expression.
• Tag name: the data field is taken as a stream name. Tagdebug will halt when processing enters this tag. A stream position can also be specified by placing it after a hash (#) character, for example para#122, in which case the breakpoint is equivalent to a location breakpoint as specified from the right click menu from the source window.
The watch variables window
This window shows the values of arbitrary variables and expressions. It consists of a listbox displaying the results, a text entry for typing in new variables/expressions to be evaluated, an Add button for moving the new expression into the listbox and a Delete button for deleting a selected item from the listbox.
The types of PTC ALD expressions as used by the watch variable window and the breakpoint window are:
• an PTC ALD variable, e.g. ^varname
• an PTC ALD function, e.g. ^[func args...] NB. the first ^ is optional here
• an PTC ALD counter, e.g. (x(42))
• an PTC ALD algebraic expression, e.g. (x(22) == x(23))
The counters window
This is defined by string number 1481. The window consists merely of a listbox showing all non-zero PTC ALD numeric counters, i.e. counters a to o and x(0) to x(200).
The string counters window
This is defined by string number 1482. The window consists merely of a listbox showing all non empty PTC ALD string counters, i.e. counters $(0) to $(100).
| All the tagdebug windows have the controls(3) dialog setting which indicates that their screen position is saved when the dialog is closed. These saved positions are only used if the global APP interface preference save dialog sizes and positions is activated (see > > > ). |
Key Mappings
The tagdebug window uses the following keyboard shortcuts; they mimic to some degree the corresponding functions in Microsoft’s Visual Studio. Note, however, that some apply only when focus is on the main tagdebug window, while others work when focus is on any of the tagdebug windows.
• F5: Run to next breakpoint. If no breakpoints encountered, it runs to the end of the document. This key mapping applies to all tagdebug windows.
• F10: Step over a tag. Note that the tag you step over might trigger a breakpoint which results in the debugger stepping into the tag. This key mapping applies to all tagdebug windows.
• F11: Step into a tag. If the next tag contains further tags, this will cause the debugger to stop at the first tag within it; otherwise it steps across it. This key mapping applies to all tagdebug windows.
• ShiftF11 Step out of a tag; processing will continue until everything beneath the current parent tag has been completed. This key mapping applies to all tagdebug windows.
• F6: Add a breakpoint at the current cursor location. This applies only to within the main tagdebug window but is also available by right clicking at the desired location in the source window, then selecting the appropriate entry from the menubox.
• CtrlF10: Run to cursor. This action creates a temporary breakpoint at the cursor position in the source window and then fakes an F5 to attempt to run to the cursor location. This applies only to within the main tagdebug window but is also available by right clicking at the desired location in the source window, then selecting the appropriate entry from the menubox.
JavaScript and the tag debugger
Some limited JavaScript debugging functionality is included in the tag debugger. It’s possible to set a breakpoint inside JavaScript code by inserting a debugger statement into the code at the desired location. This keyword is very much like PTC ALD<?breakpoint> PI in that it doesn’t have any effect unless the formatting process is started from the tagdebug dialog box. When the JavaScript code is executed during formatting, formatting stops at the debugger statement and the current script is displayed in the tagdebug dialog box with the cursor pointing at the debugger statement. Just as with conventional tags, the tagdebug dialog permits the user to select any tags that are currently active and to see how far formatting has progressed through those tags.
Limitations
tagdebug does not provide any support for:
• Debugging PTC ALD scripts (note: the trace macro allows for single stepping through a script)
• Debugging Perl scripts
• Debugging on PTC ALD run on other platforms: tagdebug is Windows specific (it makes use of DB_MODELESS which has not been ported to UNIX).
• Debugging support for JavaScript is limited to placing breakpoints and viewing execution progress as described above. There is no support yet for single-stepping JavaScript code or for inspecting and modifying variables or object properties during execution. This support may be added in a later version.
Related Links