VisualVM
VisualVM is intended to be a complete Java troubleshooting tool. It has well-integrated plugins that provide a somewhat improved version of the JConsole MBeans tab and that can embed any JConsole plugin as well. Additionally, VisualVM provides many other useful capabilities, including the ability to trigger and examine heap dumps, analyze core dumps, trigger stack dumps, graph memory and thread usage, and perform memory and CPU profiling.
VisualVM is bundled with the JDK starting with Java 6 Update 7, which is used on Windows, Solaris, and Linux systems.
Getting Started with VisualVM
You can access VisualVM from the bin directory of the JDK:
• On a Windows system, start VisualVM by double-clicking jvisualvm.exe.
You can also select VisualVM from the Start menu (if Windchill shortcuts are installed).
• On other systems, start VisualVM by invoking the jvisualvm script.
You can also use the wt.util.jmx.SMVisualVM command line utility to connect to VisualVM. The utility directly connects to the server manager using the local JMX connection and is useful in cases where your server processes are not automatically visible to VisualVM. for example, you can use the utility when Windchill is run as a Windows service and thus, by default, under a different user.
For detailed instructions on using VisualVM to manage and monitor applications, use the following URL:
Working in VisualVM
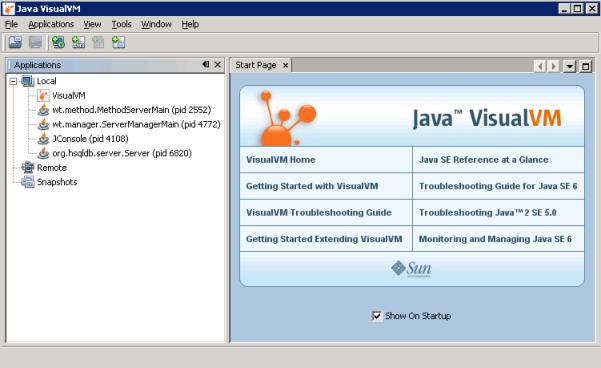
After you start VisualVM, you can see the tree of Java processes that are running locally under the current user ID and that are configured to allow JMX connections. The window presented is similar to the following:
Each node displayed in the tree indicates the process ID and the main Java class that is being run. In this example, the server manager and method server are easily identifiable by their class names.
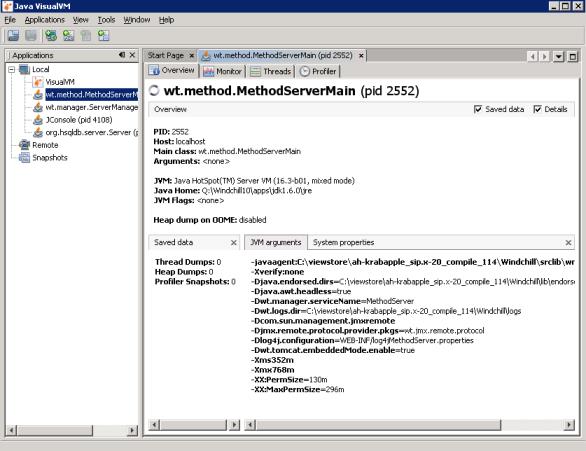
Select one or more of the process nodes and then select Open from the Applications menu. If you select the main method server class, a display similar to the following opens:
The main window provides the following tabs:
• Overview – provides details on data that has been saved, JVM arguments, and system properties. From this tab, you can view the parameters that are being used in the JVM.
• Monitor – Graphs heap and perm gen memory usage, loaded classes, and thread counts over time. Displays the JVM uptime (how long it has been running). Allows a GC (garbage collection) to be requested. Allows a heap dump to be produced, which VisualVM can then open and examine in detail.
• Threads – Graphs the state of all threads in the JVM with respect to time and allows you to examine this data on a per thread basis. Also allows you to produce and view a thread dump.
• Profiler – Allows you to start and stop CPU and memory usage profiling, examine the resulting data, and so on.
• MBeans – provides the interface from which you can do activities such as set logging options, properties, and email options, and monitor JVM activities. This tab is not present until you install the VisualVM-MBeans plugin. See the section Installing VisualVM Plugins.
• JConsole Plugins – lists the plugins you have installed. This tab is not present until you install the VisualVM-JConsole plugin. See the section Installing VisualVM Plugins.
After you have mastered the basic navigation techniques for VisualVM, you can easily adapt the JConsole examples provided later in this chapter to learn about how to perform some basic Windchill-specific tasks from VisualVM since the MBeans tabs in VisualVM and JConsole are very similar.
| Out-of-the-box, Windchill only allows local JMX connections, essentially those belonging to the same user ID and user account. |
To allow VisualVM (and other JMX management consoles) to connect remotely, additional configuration is required. For information on remote management, see
Remote JMX Monitoring.
Installing VisualVM Plugins
The previous figure shows MBeans and JConsole Plugins as tabs in VisualVM. These tabs are necessary to bring the VisualVM JMX management and monitoring capabilities on par with the JConsole capabilities, but are not actually present until you install the plugins for them.
To install these plugins (and others as desired), do the following:
1. Select Plugins from the Tools menu.
2. Check VisualVM-JConsole and VisualVM-MBeans from the Available Plugins tab.
3. Select Install and complete the installation process as prompted.
After installing VisualVM-JConsole on a Windchill server, you can add the plugin that is in the WtJmxPlugin.jar file (which adds the Windchill tab to the user interface) using the following steps:
1. Select > > > .
2. Select WtJmxPlugin.jar from the <Windchill>/codebase/lib directory, where <Windchill> is the Windchill installation directory.
If you are using VisualVM remotely, you can download the WtJmxPlugin.jar file from your Windchill server to the remote server and then select the file on your local server.
After completing this action, VisualVM loads the plugin each time it starts. When loaded, go to the JConsole Plugins tab in VisualVM to access plugins. For additional information about the
Windchill tab, see the section Windchill Tab Information in
JConsole.