Creating Custom Graphical Representations
Certain types of business information are intended for providing business insights “at a glance” and are best represented graphically rather than as text. Windchill uses graphical representations like icons to represent some of the information. You may have custom attributes which, if represented graphically, makes your users more efficient. You can create your own graphical representations if you find that the existing three out-of-the-box graphical representations for attributes are not sufficient for your needs.
The available out of the box the graphical representations are described in detail in the
Reference section.
Objective
Scope/Applicability/Assumptions
Graphical representations can only be applied to calculated attributes. Particular representations may only apply to calculated attributes of specific data types and may only support a well-defined subset of the possible formula results. See the Solution Elements section for more info on the scope, configuration, and limitations of the three out-of-the-box graphical representations.
Intended Outcome
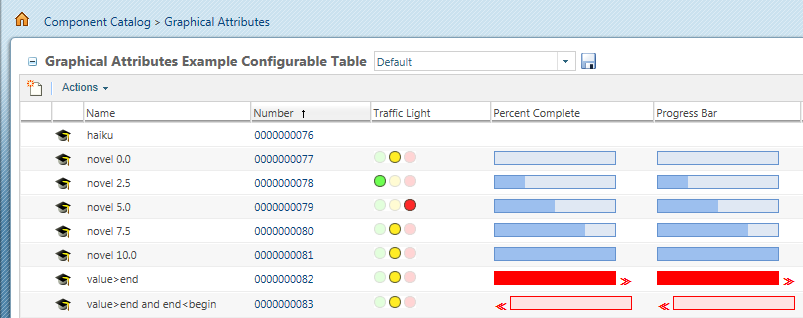
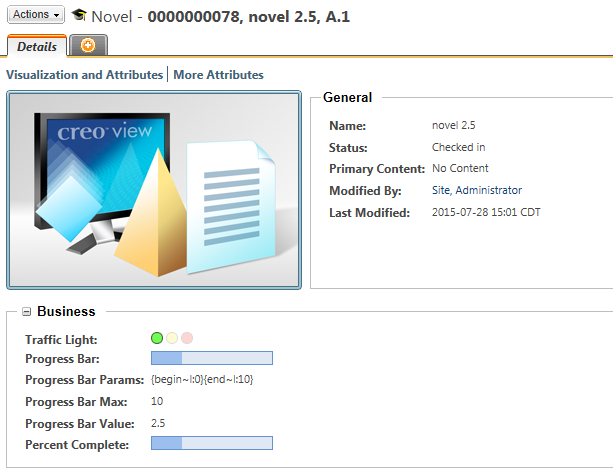
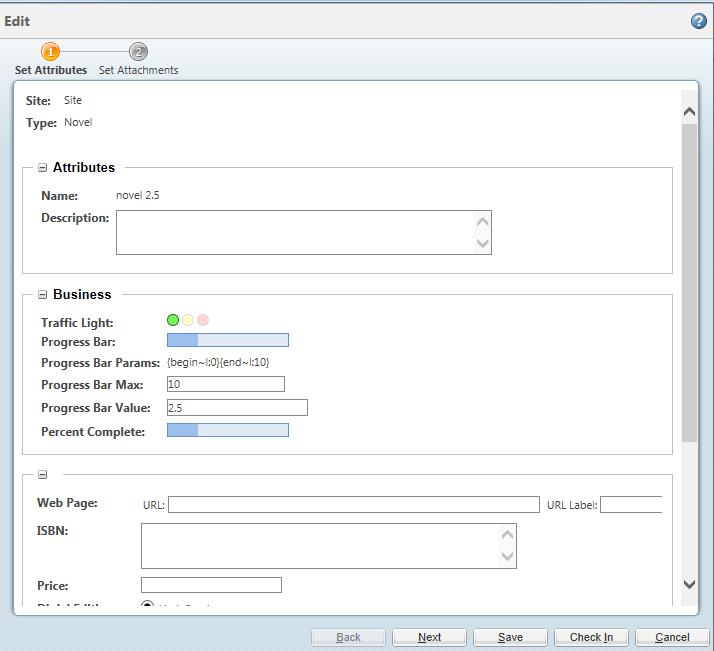
When an attribute is configured with a custom graphical representation, it displays as graphical throughout the product in all tables that support graphical attributes, in information pages and wizards.
The following are examples of the three available out-of-the-box graphical representations in various Windchill UIs:
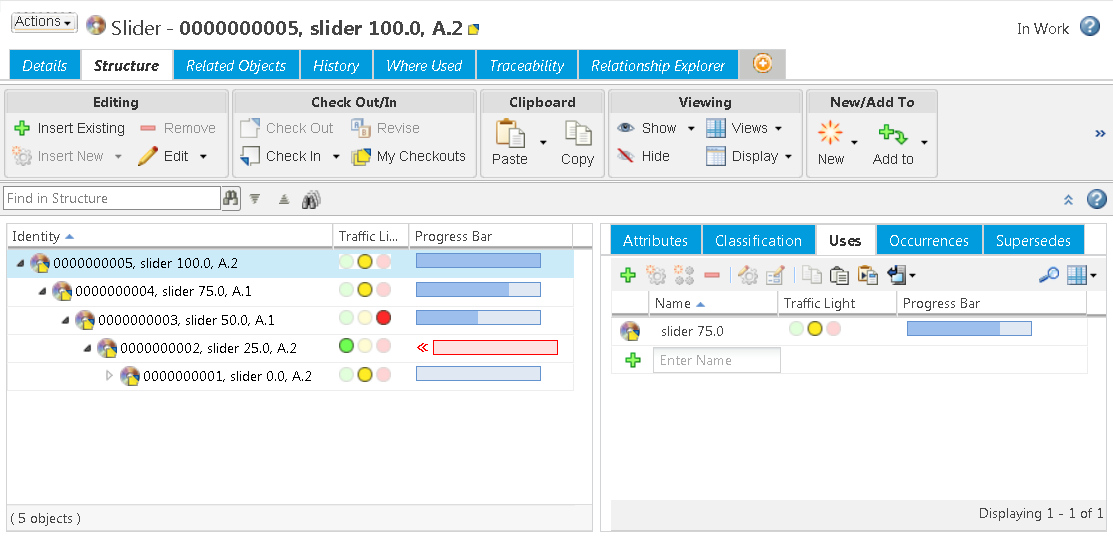
Graphical representations are also supported in GWT based user interfaces: