Interpreting Predictive Scoring Results with Confidence Models
Predictive models can be scored to generate insight into likely future conditions. When scoring any predictive model, the results include both goal prediction and model output fields. When scoring with one or more confidence models, results include additional information about the uncertainty in a prediction. This additional information is represented by fields for confidence maximum and confidence minimum values. Understanding the information contained in these results is key when building applications so that predictive insights can be obtained and used appropriately.
Key Result Fields
The results from scoring a predictive model with one or more confidence models contain the following key fields:
• Goal Prediction – The predicted value of the goal variable for a specific result record. This column represents the predicted value from the model. In the examples below, the results have been output to a CSV file and the header row displays the Goal field name.
• Confidence Maximum – An upper bound on the predicted value for a specific record based on the supplied confidence level. The field name includes the goal name + the confidence level + Confidence_Max. In the examples below, the results have been output to a CSV file and the header row displays the Confidence Maximum field name.
• Confidence Minimum – A lower bound on the predicted value for a specific record based on the supplied confidence level. The field name includes the goal name + the confidence level + Confidence_Min. In the examples below, the results have been output to a CSV file and the header row displays the Confidence Minimum field name.
• Model Output – The PMML score for the predicted goal before the value is denormalized or transformed to become the Goal Prediction. A suffix of_mois attached to the field name to identify it as the raw model output score. The meaning of the model output information varies based on the OpType of the goal variable. For more information about model output values, see Interpreting Predictive Scoring Results.
The values for both the goal prediction and the model output can be interpreted for scoring with confidence models the same as they are interpreted for scoring without confidence models. For more information about these columns, see Interpreting Predictive Scoring Results.
The values for the confidence maximum and minimum are specific to scoring with confidence models and can vary depending on the OpType of the goal variable. The sections below provide sample results from predictive scoring with different types of data. In most of the samples, only columns specifically related to confidence model results are shown.
|
|
In ThingWorx Analytics 8.5.x, confidence model functionality is available for continuous and ordinal data only.
|
Sample Confidence Model Prediction Results for Continuous Data
Predictive scoring with a confidence model for a continuous goal returns a range of actual values for each prediction. The range is represented by the confidence maximum and minimum columns. Together, these columns represent the upper and lower bounds of the confidence interval for a given prediction. If the confidence model was generated with multiple confidence levels, confidence maximum and minimum columns are included for each confidence level.
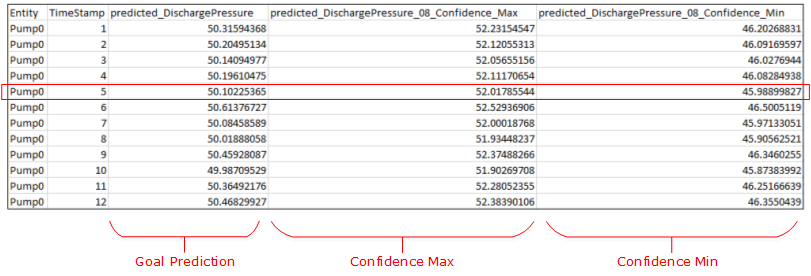
The image below shows sample results from a time series predictive scoring job monitoring the discharge pressure from a pump. The goal variable, DishargePressure, is a continuous parameter and the scoring results show the predicted pump discharge pressure over time. The confidence model was generated with a confidence level of 0.8. For each point in time, the results can be interpreted as follows: the model is 80% confident that the pump discharge pressure lies in the range between the confidence minimum and the confidence maximum.
For example: The model is 80% certain that the pump discharge pressure at time stamp 5 is between 46.0 PSIG and 52.0 PSIG.

Not shown in the sample above: The model output column, which show the normalized score value, and the error message column.
Sample Confidence Model Prediction Results for Ordinal Data
Predictive scoring with a confidence model for an ordinal goal returns a range of normalized values for each prediction. The range is represented by the confidence maximum and minimum columns that indicate the upper and lower bounds of the confidence interval for a given prediction. The scoring job also transforms the confidence minimum and maximum values, and outputs the range for each prediction in the ordinal scale as well. If the confidence model was generated with multiple confidence levels, the results returned include confidence minimum and maximum ranges in both normalized values and in the ordinal scale for each confidence level.
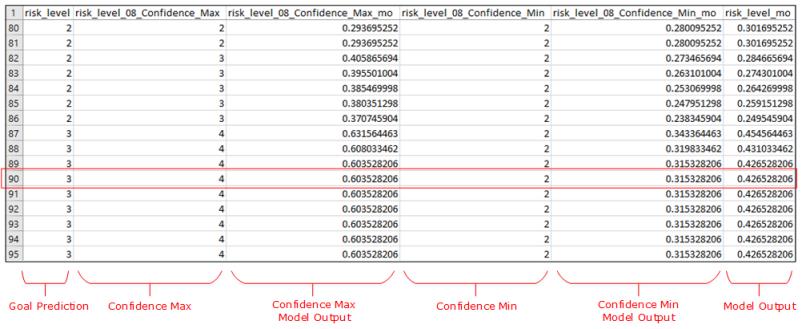
The image below shows sample results from a time series predictive scoring job that monitors risk of failure across time. The goal variable, risk_level, is an ordinal parameter that can contain risk level values from 0 to 7. The confidence model was generated with a confidence level of 0.8. For each record, the results show a normalized range represented by the model output columns: Confidence_Max_mo and Confidence_Min_mo. The values in these model outcome columns are converted back to the ordinal scale and presented in the Confidence_Max and Confidence_Min columns. For each record, the results can be interpreted as follows: the model is 80% confident that the risk level for failure lies in the range between the confidence minimum category and the confidence maximum category.
For example: The model is 80% certain that the risk level for record 90 lies between 2 and 4.

Not shown in the sample above: The error message column.