Manage an Analysis Provider
After you have created an analysis provider, you can edit, view, or delete the analysis provider.
Edit an Analysis Provider
|
|
You can edit an analysis provider only if it does not have any models, jobs, or events associated with it.
|
Complete the following steps to edit an analysis provider:
1. From the left navigation pane, select Analysis Providers.
2. On the Analysis Providers page, select the analysis provider that you want to edit, and click Edit.
3. Update the information in the Edit Analysis Provider window. For information about different fields in the Edit Analysis Provider window, see Create an Analysis Provider.
4. Click Save.
View an Analysis Provider
Complete the following steps to view information about an analysis provider:
1. From the left navigation pane, select Analysis Providers.
2. On the Analysis Providers page, select the analysis provider for which you want to view information, and click View.
The information page of the selected provider is displayed. You can view the following information about the analysis provider that you selected:
◦ Click Information to view the General Information page. This page provides information that you entered while creating the provider.
◦ Click Models to view the Analysis Models page. This page provides a list of all the models that are associated with the provider that you selected. You can manage models from this page. For more information about managing models, see Manage an Analysis Model.
◦ Click Jobs to view the Analysis Job Summary page. This page provides a list of all the jobs that are associated with the provider that you selected. You can manage jobs from this page. For more information about managing jobs, see Managing Jobs.
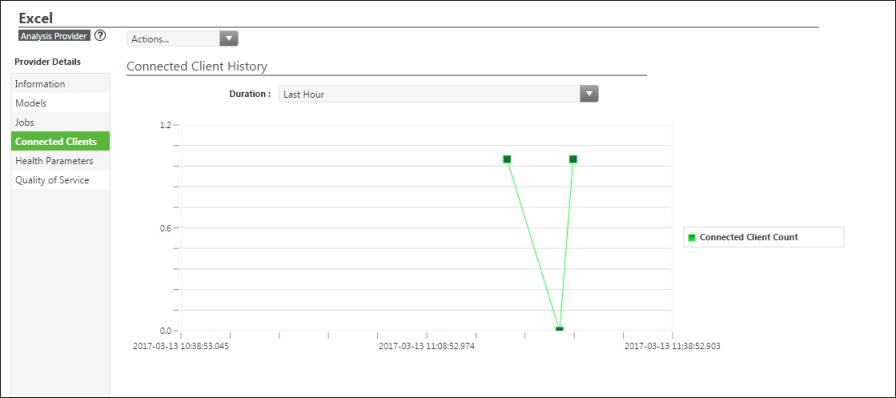
◦ Click Connected Clients to view the Connected Client History page. This page provides a graphical representation of the number of active clients connected to the specific provider over a period of time. In the Duration list, select the time period over which you want to view the number of connected clients.
◦ Click Health Parameters to view the History of health parameters on selected Agent host and Client process page. This page provides a graphical representation of the health of active agents and clients connected to a selected provider over a a period of time, and the list of users running active replays.
▪ Health of Agent Host — This graph provides the health of the agent host. The agent enables the connection between the client and the server. If you have enabled flexible scaling in Analytics Manager, then the agent can launch multiple client processes at the same time, if required. The health of the agent host is displayed with respect to the following parameters:
▪ Percent CPU used — This metric shows the percent of CPU used by the agent over a period of time.
▪ Percent Memory used — This metric shows the percent of memory used by the agent over a period of time.
▪ Percent Disk used — This metric shows the percent of disk used by the agent over a period of time.
Place your cursor over any part of the graph to view the value of the metric at the selected time.
In the Duration list, select the time period over which you want to view the health of the agent host.
▪ Health of Client Process — This graph provides the health of the client process. If the agent has launched multiple clients at the same time, this graph provides information of all the client processes with respect to the following parameters:
▪ Percent CPU used — This metric shows the percent of CPU used by the client over a period of time.
▪ Percent Memory used — This metric shows the percent of memory used by the client over a period of time.
Place your cursor over any part of the graph to view the value of the metric at the selected time.
In the Duration list, select the time period over which you want to view the health of the client process.
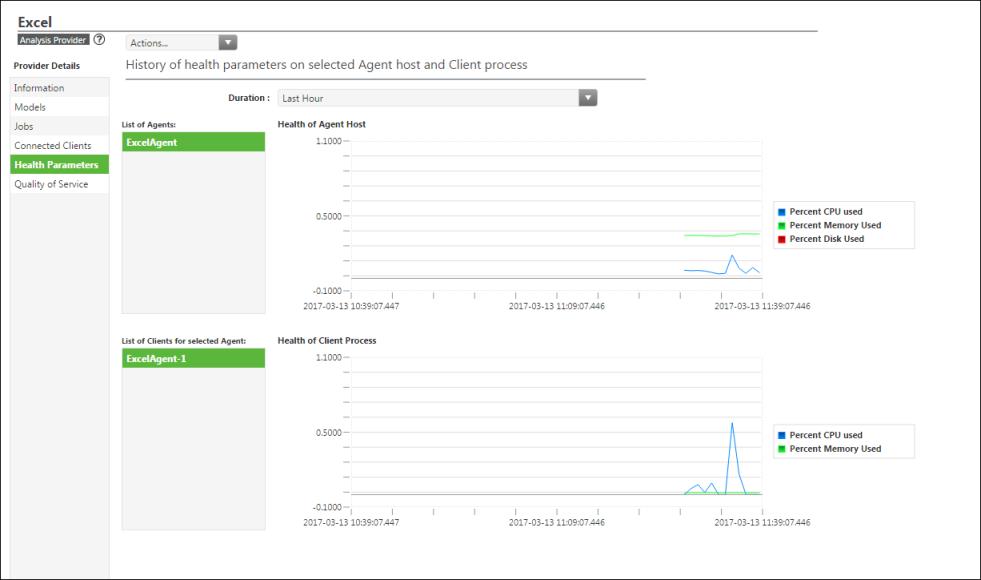
▪ List of Users running Active Replays — For a specific provider, this table provides the user name and the replay name running on a particular agent. If you have multiple agents for a specific provider, from the List of Agents list, select the agent for which you want to view the active replays.
◦ Click Quality of Service to view the Quality of Service Rules page. This page displays all the Quality of Service rules that have been created for all analysis providers. It provides options to create and manage Quality of Service rules. For more information, see Create a Quality of Service Rule.
3. If you want, you can edit the analysis provider that you have selected. In the Actions list, click Edit to edit the analysis provider.
Delete an Analysis Provider
You can delete an analysis provider only if it does not have any models, jobs, or events associated with it. |
Complete the following steps to delete an analysis provider:
1. From the left navigation pane, select Analysis Providers.
2. On the Analysis Providers page, select the analysis provider that you want to delete, and click Delete.
3. When you are prompted for confirmation, click Yes in the Confirm Action window.