Using PSM Metrics to Monitor Memory Issues
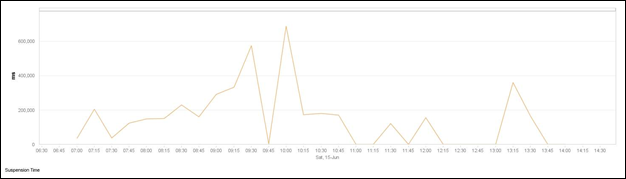
PMS tracks the time duration for which JVM was unresponsive due to garbage collection. The amount of time spent in suspension (not actively performing work) is determined by creating a custom graph, which is available at the > > > > > option.
With the recommended Garbage First (G1) collector, the JVM suspends activity for a maximum of 200 ms at a time. Generally, ThingWorx remains responsive with pauses in the range of 200 ms to 5000 ms. The following graph shows scenarios where the entire application is unresponsive for long periods.
Usually, periods of slow GC activity correspond to periods of high memory usage. The memory usage, shown at the operating system level does not retrieve data on how much memory Java is using internally to its heap. You can get this information in PSM using the > > > > > option.
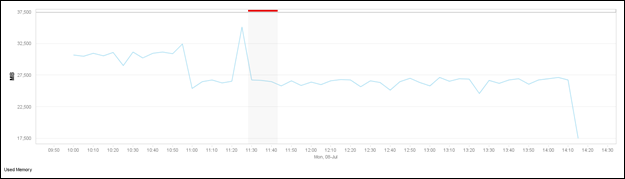
When Java consistently uses high memory internally, it can become a performance bottleneck. PSM is used to drill-down into any period of high GC suspension or high memory usage to identify the underlying user transactions at that time. Long PurePaths that correspond to memory issues should be investigated.
PSM creates an incident if the application is in out-of-memory state. For any out-of-memory condition, PSM generates the mentioned two graphs to help identify when the memory usage spike occurred. You can drill-down into specific transactions by analyzing the PurePaths that were executed at that time.
Recommendation—Set up the PSM alerting or a daily schedule to check JVM suspension time and used memory. Monitor for any out-of-memory incidents in PSM.